Author: Orloff Phillips

  • What Vendor Alignment Actually Means and Why Most IT Vendor Portfolios Lack It

    What Vendor Alignment Actually Means and Why Most IT Vendor Portfolios Lack It

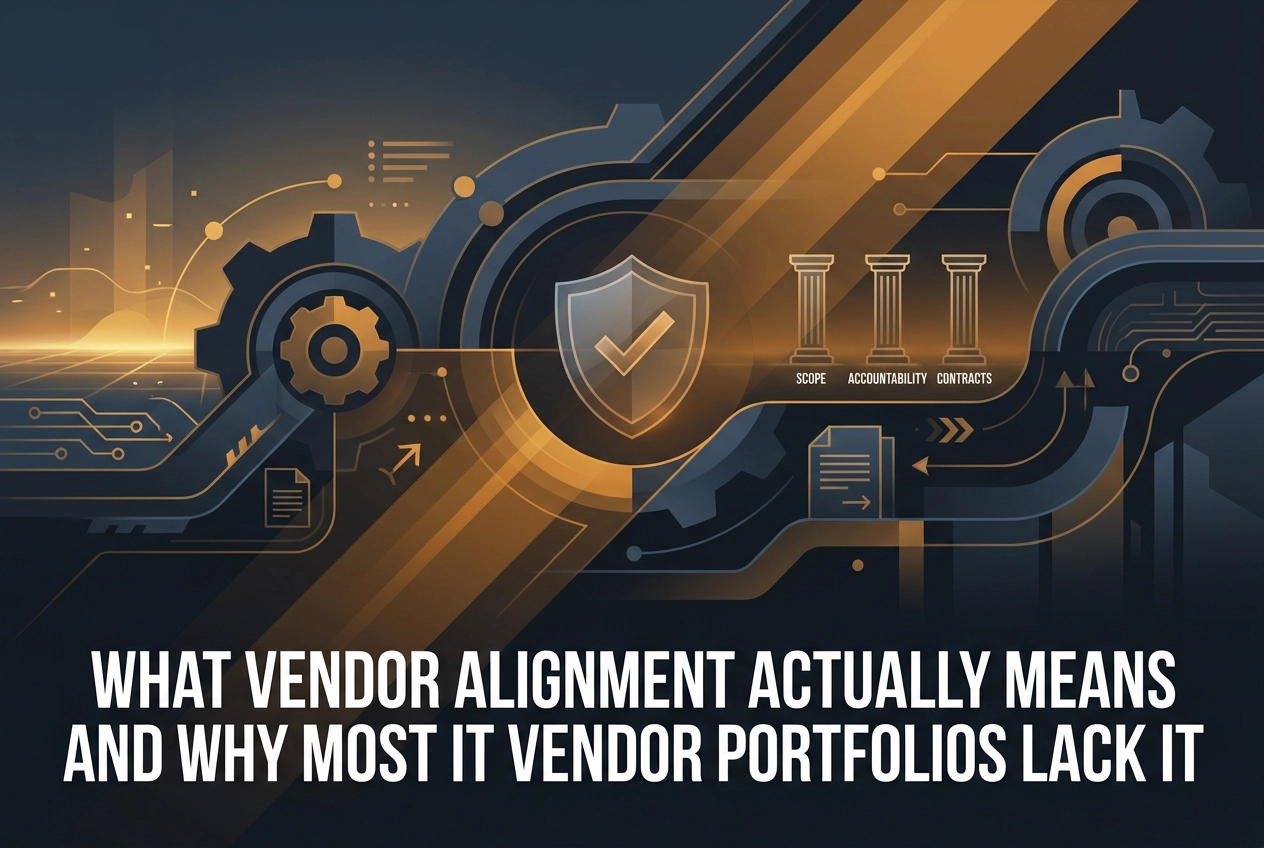
    Most IT leaders believe they have a vendor management problem. What they actually have is an alignment problem, and the distinction matters more than most organizations recognize. Vendor alignment is not a headcount exercise or a consolidation initiative; it is the structural condition in which every technology vendor in your portfolio carries a defined scope, measurable accountability, and contract terms that reinforce each other rather than work against your operational goals. Without it, even a lean vendor portfolio can generate redundancy, coverage gaps, and accountability failures that no single internal owner can resolve.

    The uncomfortable truth is that most businesses have never designed their vendor portfolio. They have accumulated it, one reactive decision at a time, until the resulting structure became too complex to manage and too entangled to fix quickly. This post examines what genuine vendor alignment requires, how misalignment forms and compounds over time, and what the governance, contractual, and operational architecture of a properly designed portfolio actually looks like. If you manage vendor relationships at any level of organizational complexity, what follows will reframe how you diagnose the problems you are already living with.

    What Vendor Alignment Actually Means

    The concept is frequently confused with adjacent disciplines. Vendor consolidation reduces vendor count. Vendor coordination manages day-to-day communication between active vendors. Vendor management handles ongoing relationship oversight. Alignment is the architectural layer beneath all three; it is the condition those disciplines are supposed to maintain, not the activity itself.

    Three conditions must hold simultaneously:

    • Every vendor holds a defined, non-overlapping scope
    • Every vendor has measurable accountability tied to specific deliverables and performance standards
    • Contract terms across the portfolio reinforce rather than conflict with each other

    Remove any one condition and the other two cannot compensate. A vendor with a well-defined scope but no measurable accountability still produces disputes. A vendor with clear performance standards operating under a contract that conflicts with an adjacent vendor’s terms still produces coverage failures.

    The critical implication: alignment is an intentional design output. It cannot emerge organically from a reactively accumulated portfolio, regardless of how well individual vendor relationships are managed. Goodwill between a business and its vendors does not substitute for structural coherence between contracts.

    For mid-market businesses across the Philadelphia metro region, this distinction carries real operational weight. Most IT environments have layered vendors over years in response to immediate pressures, without an integrating architecture governing how those vendors relate to each other. The result is a portfolio that functions adequately in isolation but fractures under cross-vendor stress.

    How Most Vendor Portfolios Are Actually Built

    Understanding why alignment is absent requires looking at how most portfolios were built in the first place. The answer is rarely negligence; it is accumulated reaction.

    Most businesses add vendors in response to immediate pressure. A compliance deadline surfaces and a new security tool gets procured. An MSP recommends a backup solution and it gets added. A department identifies a capability gap and contracts a point solution independently. Each decision is locally rational. Collectively, they produce a portfolio that was never designed as a system, because it wasn’t. As research on supplier portfolio dynamics confirms, “supplier count often grows faster than supplier strategy,” and the portfolio that results “looks flexible from the outside but feels chaotic from the inside.”

    Leadership transitions compound the problem. When the IT director who negotiated a contract leaves, the rationale for that vendor leaves with them. Renewals get handled by calendar date rather than by any evaluation of whether the vendor still fits. Within a few years, no one inside the organization can explain why specific vendors were selected or whether their current scope reflects any deliberate architectural decision.

    The failure signatures of this pattern are consistent and recognizable: overlapping scopes that neither vendor fully claims ownership of, coverage gaps where each vendor assumes the adjacent responsibility belongs to someone else, and contracts negotiated in isolation that now conflict operationally. These are not performance failures; they are structural ones.

    What sustains the problem is the absence of vendor lifecycle management as an active discipline. Exit decisions require more effort than vendor additions, so portfolios accumulate without corresponding pruning, interdependency evaluation, or stress-testing against the current operational model. The result, as seen in engagements where reactive accumulation is diagnosed and corrected, is not a collection of underperforming vendors but a portfolio architecture that was never designed to perform cohesively.

    The fragmentation is the architecture. That distinction matters, because it determines where the fix has to start.

    The Three Structural Failures That Define a Misaligned Portfolio

    Reactive accumulation produces predictable structural damage. That damage concentrates into three failure patterns, each with a distinct operational signature.

    Scope redundancy occurs when two or more vendors hold contracted responsibilities that overlap. The immediate cost is financial: the business pays twice for the same capability. The deeper cost is accountability diffusion. When two vendors share responsibility for an outcome, neither owns it fully, and both have an incentive to interpret their obligations narrowly when performance is questioned.

    Gap coverage failure is the inverse condition. Adjacent vendor scopes leave uncontracted territory that each vendor reasonably treats as outside their remit. No vendor is technically wrong; the gap simply exists because no one designed the boundary. The operational problem is timing: these gaps are invisible until an incident exposes them, at which point the cost of discovering unowned territory is measured in downtime, not in contract review hours. If you’ve experienced the frustration of a failure that no vendor would fully own, recognizing when your MSP relationship has structurally broken down is a useful diagnostic starting point.

    Fragmented accountability chain is the compounding failure. When no internal owner can trace a service failure back to a specific contractual obligation, the organization absorbs operational risk that should belong to a vendor. The risk does not disappear; it transfers inward, silently.

    Vague contract terms accelerate all three conditions. When deliverables, timelines, and performance standards are not explicitly defined, accountability becomes a negotiation after the fact rather than a measurement against a standard. Disputes are the predictable output.

    These failures do not operate independently. A portfolio with scope redundancy almost always develops gap coverage failures over time, because vendors under pressure retreat to their narrowest contractual interpretation, and the space between interpretations becomes unowned territory.

    Why Vendor Consolidation Alone Does Not Solve the Problem

    Recognizing those three structural failures often triggers an immediate response: reduce the vendor count. Consolidation feels decisive. It simplifies invoicing, shortens the vendor list, and signals operational discipline. The problem is that it treats a symptom rather than the condition.

    The structural failures described above do not disappear when the vendor count shrinks, unless alignment conditions are explicitly redesigned in the process.

    The most common consolidation mistake is optimizing for the wrong metric. Procurement teams measure success in contract count and invoice volume because those numbers are visible and easy to report. Alignment is neither. Reducing monthly vendor invoices from twelve to seven is a financial outcome; it says nothing about whether the remaining seven vendors have coherent, non-overlapping scopes or whether any of them now owns a coverage gap the eliminated vendors were quietly filling.

    That last point carries serious operational risk. Vendors that appear redundant from a procurement perspective are sometimes providing informal gap coverage that no contract explicitly documents. Eliminating them without mapping vendor interdependencies through a structured IT infrastructure audit leaves those gaps invisible until an incident forces them into view.

    Consolidation decisions made exclusively at the procurement layer, without direct input from the operational teams who depend on vendor outputs daily, consistently produce portfolios that look leaner on paper and perform more fragility under pressure. The people who know which vendor is actually being called at 9 p.m. during an outage are rarely in the room when the contract reduction decision is made.

    Alignment-driven consolidation is a legitimate and valuable goal. It becomes achievable only when the process begins with a full portfolio audit mapping current scope, accountability ownership, and contract terms across every active vendor relationship. Reduction decisions made after that audit can be structural. Reduction decisions made before it are guesswork.

    The Governance Architecture That Alignment Requires

    Redesigning consolidation decisions without rebuilding the governance layer that holds those decisions in place produces the same fragmentation under a smaller vendor count. The structural fix requires architecture, not just reduction.

    Vendor alignment governance operates at two distinct levels. At the enterprise level, someone owns portfolio-wide decisions: which vendors belong in the portfolio, how scopes are bounded relative to each other, and whether the portfolio as a whole is delivering coherent operational outcomes. This is precisely the function a part-time technology executive performing strategic oversight fills for mid-market businesses in the Philadelphia metro region that lack a full-time CIO. At the service level, individual vendor relationships require owners accountable for specific performance standards within defined tiers.

    Tiered classification is what makes differentiated governance sustainable. Separating core infrastructure vendors from mission-critical vendors from business-critical vendors allows the organization to apply rigorous oversight where operational exposure is highest without generating administrative burden across every vendor relationship simultaneously. Without that separation, governance either collapses under its own weight or gets applied uniformly at the lowest common denominator.

    The accountability gap most organizations experience is an architecture failure, not a personnel failure. Without a defined governance model, cross-vendor issues default to whoever escalates loudest internally rather than whoever contractually owns the outcome. That default pattern is not fixable by hiring better people; it is fixable only by documenting which internal owner is responsible when a service failure crosses vendor boundaries. The absence of that documentation is where fragmented accountability becomes operationally dangerous, converting every multi-vendor incident into an improvised internal negotiation.

    Governance frameworks are not administrative overhead. They are the mechanism that keeps alignment conditions intact as vendor contracts are renegotiated, personnel turns over, and the portfolio adds new relationships. Alignment designed without a governance structure to maintain it degrades at the first contract renewal cycle.

    Contract Engineering as an Alignment Tool

    Governance architecture defines who owns alignment decisions. Contract engineering determines whether the documents those owners are responsible for can actually support accountability in practice.

    Most vendor contracts are negotiated in isolation. Each vendor’s legal team optimizes for that vendor’s interests, which is rational from their position. The problem emerges at the portfolio level: a set of contracts that are individually defensible but collectively incoherent, with overlapping scope definitions in some places and uncontracted territory in others.

    Scope of work definitions are where most contracts fail operationally. A scope clause that describes services in general terms cannot function as an accountability tracking tool. Effective SOW language specifies discrete deliverables, explicit timelines, and measurable performance standards. When payment terms are tied to milestones rather than calendar dates, each payment cycle becomes an operational checkpoint, not just a financial one. The business retains structural leverage that monthly invoicing permanently surrenders.

    Termination clauses deserve equal scrutiny. Exit conditions written in vague terms create transitions that collapse into disputes. An alignment-ready termination clause names specific failure-to-deliver scenarios, defines breach thresholds, and obligates the exiting vendor to provide transition support. Without those provisions, replacing a vendor becomes an operational emergency rather than a managed handoff.

    Cross-portfolio contract review is a discipline most businesses in the Philadelphia metro region have never performed. Reading contracts sequentially, each appears reasonable. Reading them side by side exposes overlapping scope definitions, contradictory performance standards, and accountability gaps that no individual contract review would surface. Businesses with clear engagements and clear outcomes built into every vendor relationship do not discover these conflicts during incidents; they resolve them at the drafting stage.

    Calendar-based payment structures are a contract engineering choice with alignment consequences. They transfer leverage to the vendor the moment a contract is signed. Milestone-tied structures keep accountability measurable at defined intervals and preserve the organization’s ability to enforce performance standards rather than simply document their breach after the fact.

    MSP Relationships and the Specific Alignment Challenge They Create

    Contract terms, however precise, only produce alignment if the underlying scope architecture is sound. For businesses that rely on a Managed Service Provider, that architecture is where the hardest alignment work lives.

    MSP contracts differ from point-solution vendor contracts in three structural ways: they span broader operational domains, run on longer terms than typical point-solution contracts, and embed the MSP into infrastructure that the business cannot easily extract from mid-cycle. Those characteristics make scope drift more likely and misalignment more costly to correct.

    The overlap problem is predictable and nearly universal. A business establishes its MSP relationship first, then adds point-solution vendors over subsequent years to address specific gaps: a cloud backup vendor, a cybersecurity platform, a communication tool. Each addition is evaluated independently. Nobody audits whether the new vendor’s contracted scope duplicates something already inside the MSP agreement. Redundancy and gap coverage failures accumulate quietly, with neither party explicitly acknowledging the conflict, so it remains contractually invisible until an incident forces the question.

    Accountability diffusion compounds the problem. Most MSP agreements define performance at the relationship level, not the service level. Response time commitments and satisfaction ratings describe the MSP’s overall conduct. They do not assign measurable accountability to specific services or outcomes. When a failure occurs, the absence of service-level granularity converts what should be a contractual determination into an interpretive argument, and those arguments rarely resolve quickly or cleanly.

    Aligning an MSP relationship with the rest of the portfolio requires a specific diagnostic: what does the MSP own end-to-end, what does it share with adjacent vendors, and what has it informally assumed without contractual backing? That third category is often the largest.

    For businesses across the Philadelphia metro region that depend on an MSP as their primary IT partner, the MSP contract is the highest-leverage alignment intervention available. Scope clarity at that level propagates downstream across every vendor relationship it touches. A live conversation on real execution is often where that diagnostic process begins.

    How to Assess Whether Your Vendor Portfolio Is Aligned

    Once the MSP scope question is resolved, the same analytical discipline extends to every other vendor in the portfolio. Assessment follows five steps, applied in sequence.

    Complete vendor inventory. Document every active vendor: contracted scope, performance standards, internal accountability owner, and contract expiration date. Most organizations in the Philadelphia metro region discover they cannot finish this inventory without significant effort. That difficulty is itself diagnostic. If your team cannot quickly produce a complete, accurate list, the portfolio lacks the basic visibility that alignment requires.

    Interdependency mapping. For each vendor, identify which adjacent vendor relationships are required for that vendor to actually deliver its contracted outcome. Then check whether any of those dependencies appear in any contract. They rarely do. Undocumented dependencies are where gap coverage failures live before an incident makes them visible.

    Accountability stress testing. Select three to five recent operational incidents or service failures. For each one, trace the accountability chain backward: which vendor contractually owned the outcome, whether that vendor was held accountable, and what the resolution path actually looked like. This exercise surfaces fragmented accountability chains faster than any document review. If the answer to “who owned this” is “it depends,” the portfolio is misaligned.

    Contract coherence review. Read vendor contracts side by side, not in sequence. Flag scope definitions that overlap between vendors, performance standards that contradict each other, and termination conditions that would create a coverage gap if triggered. Contracts negotiated in isolation rarely contradict themselves individually; incoherence only appears when they are examined together.

    Vendor lifecycle management review. For each vendor relationship, assess whether the original rationale still holds, whether contracted scope matches current usage, and whether the contract terms reflect the current risk the relationship carries. Portfolios built reactively over several years routinely contain vendors whose scope has drifted significantly from what was originally contracted, creating both redundancy and uncovered risk.

    Building Toward Alignment: The Transition from Reactive to Designed

    Once the audit findings are in hand, the path forward is a phased discipline, not a single cleanup project. Each phase builds on the last, and skipping ahead produces the same fragmented conditions you started with.

    Phase one is documentation: produce the complete vendor inventory using the five-step audit sequence described above. This phase routinely surfaces vendors whose operational scope has drifted well beyond, or well short of, their contracted definition. That gap is where misalignment lives, and it cannot be corrected until it is visible.

    Phase two is structural redesign. Using the audit findings, redraw scope boundaries to close gaps and eliminate overlaps. Contracts that no longer reflect operational reality need to be updated or renegotiated, not managed around. Each vendor tier requires an explicitly assigned internal owner; without named accountability, the redesigned structure will erode under the pressure of day-to-day operations.

    Phase three is governance implementation. Structural redesign creates alignment conditions; governance maintains them. This phase establishes the oversight model that keeps the portfolio aligned as it evolves: renewal review cadences that evaluate scope fit before contracts auto-renew, performance measurement processes tied to specific deliverables, and documented escalation paths for failures that cross vendor boundaries. Without this layer, the portfolio will drift back toward reactive accumulation within one contract cycle.

    The sequencing is deliberate. No reduction or renegotiation decisions belong in phase one. Organizations that jump to vendor consolidation before completing the documentation and redesign phases consistently replicate the same structural problems with fewer vendors.

    Orloff Phillips works with businesses across the Philadelphia metro region to execute this transition. Every engagement begins with the portfolio audit and governance architecture, building the structural foundation before any vendor reduction or contract renegotiation decisions are made.

    The Operational Cost of Continuing Without Alignment

    The transition work described above addresses how to fix misalignment. What it cannot recover is the cost already absorbed by operating without it.

    Redundancy charges are the easiest cost to see on an invoice, but they rarely represent the largest exposure. Paying two vendors for overlapping capabilities wastes budget directly. The more consequential waste is the accountability gap that overlapping scopes almost always produce: when two vendors share a capability, neither fully owns the outcome, and that diffusion of ownership costs far more during incidents than it does on a line-item review.

    Incident resolution time is where misalignment becomes operationally painful. When a failure crosses vendor boundaries and no defined accountability chain exists, the incident cannot be escalated externally until someone internally has diagnosed which vendor owns it. That diagnostic work is unplanned, unbudgeted, and performed under pressure. A cross-vendor failure that should take hours to resolve routinely becomes a multi-day internal project because the portfolio was never designed to answer the question of who is responsible.

    Vendor coordination overhead is a staffing cost that rarely gets attributed correctly. When scopes overlap or conflict, internal staff spend real hours brokering between vendors, translating requirements, and mediating disputes that a well-structured contract would have made impossible. This overhead scales directly with the degree of misalignment; it does not plateau.

    Strategic decisions become structurally compromised. When leadership cannot reliably assess what the current portfolio is delivering because accountability is fragmented across vendors, there is no coherent baseline against which to evaluate new technology investments. Businesses in this condition often defer or misdirect capital decisions because the data needed to make them accurately does not exist.

    The compounding problem is the most important one to understand. Misalignment does not stabilize. Each vendor added to a misaligned portfolio introduces new overlap and gap risk. The cost of not addressing alignment is not fixed; it grows with every contract signed into an unexamined portfolio.

    Alignment Is an Architecture Decision, Not a Vendor Problem

    Those compounding costs are not a vendor performance problem. They are the predictable output of a portfolio that was never architecturally designed.

    Vendor alignment cannot emerge from good vendor relationships, attentive vendor management, or even a well-executed consolidation effort unless the structural conditions were intentionally engineered in the process. Relationships change. Personnel turns over. Contracts renew with revised language. Without a designed architecture underneath, none of those activities produces lasting alignment, they produce temporary stability in a fragile system.

    Those three conditions, defined scope, measurable accountability, and coherent contract terms, are entirely within your control to build. None of these conditions require a perfect vendor roster or a reduced vendor count. They require intentional design decisions, applied consistently.

    For businesses that have accumulated vendors reactively over several years, the starting point is not a restructuring initiative. It is an honest inventory of what the current portfolio actually contains, as opposed to what leadership believes it contains. Most organizations in the Philadelphia metro region have never completed that inventory at the scope and accountability level. That gap, by itself, explains most of the friction.

    Three actions worth taking this quarter:

    • Vendor inventory audit: Document every active vendor, their contracted scope, their performance standards, and their internal accountability owner
    • Accountability stress test: Trace three recent operational incidents back through the accountability chain and identify where ownership broke down or was unresolved
    • Internal ownership assignment: Name the person responsible for cross-vendor alignment decisions before any contract is signed or renewed

    Orloff Phillips works with businesses across the Philadelphia metro region to build the portfolio architecture that operational efficiency requires. The engagement starts with alignment clarity specific to your environment, not a generic vendor reduction target.

    Conclusion

    Vendor alignment is not a procurement outcome; it is an architecture decision that determines how well your entire IT environment performs under real operational conditions. Most portfolios fail not because of the wrong vendors, but because of absent governance, unclear accountability, and contracts that were never designed to support coordination. Consolidation without structure solves nothing. The businesses that operate efficiently are the ones that have designed their portfolios with intention rather than inherited them through habit.

    The gap between where most organizations are and where they need to be is rarely about vendor quality. It is about internal clarity and deliberate design.

    If your vendor portfolio has grown reactively, now is the time to change that trajectory. Start with the audit. Assign ownership. Build the architecture your operations actually require. Orloff Phillips is ready to help you get there.


  • What a Fractional CIO Actually Costs and Whether the ROI Justifies It

    What a Fractional CIO Actually Costs and Whether the ROI Justifies It

    Most businesses searching for fractional CIO pricing are asking the right question in the wrong way. They pull up salary comparison sites, benchmark a full-time CIO’s base compensation, and use that number as their reference point. The problem is that comparison was flawed before it even started.

    The real cost equation behind a fractional CIO engagement is more nuanced, and frankly more revealing, than a simple salary-to-retainer comparison. When you account for the fully loaded cost of a full-time hire, and then factor in the price of the leadership vacuum that currently exists in its absence, the ROI calculus shifts dramatically.

    This post breaks down exactly what a fractional CIO costs, how pricing models are structured, and what the engagement actually delivers against the alternatives. You will learn how to quantify the hidden costs of deferred IT decisions, vendor misalignment, and stalled infrastructure projects. You will also walk away with a practical framework for evaluating whether a fractional CIO engagement makes financial sense for your organization, and how it stacks up against a full-time hire or project-based consulting. The honest answer on cost and ROI is here. It just requires looking at the right numbers.

    You Are Comparing Fractional CIO Cost to the Wrong Number

    Most buyers researching this topic start by Googling “CIO salary,” find a number somewhere between $180,000 and $280,000, and then evaluate a fractional CIO engagement against that benchmark. It feels like a logical comparison. It is the wrong one.

    A fractional CIO is a senior technology executive who works on a part-time or retainer basis, providing strategic IT leadership without a full-time headcount commitment. If you want the full operational picture of what that looks like in practice, this breakdown of what a part-time technology executive actually owns and delivers is worth reading before you price anything.

    The correct cost comparison is not fractional CIO pricing versus a full-time chief information officer salary. It is fractional CIO pricing versus the fully-loaded cost of having no strategic IT leadership at all, which includes deferred infrastructure decisions, unchecked vendor spend, and IT projects that stall without an executive owner.

    This piece builds that comparison across three columns: the true fully-loaded cost of a full-time CIO hire, the market range for a fractional engagement, and the cost of the leadership vacuum most mid-market companies are already absorbing without recognizing it.

    That third column is where the real number lives.

    This analysis is written for businesses in the Philadelphia, Exton, Wilmington, Cherry Hill, Lancaster, and Reading, PA region; companies that have outgrown their current IT structure but are not yet positioned to justify a $250,000 executive hire.

    The True Cost of a Full-Time CIO Goes Well Beyond Base Salary

    The base salary figure is only the starting point, and it understates the real commitment significantly.

    Industry compensation surveys suggest full-time CIO base salaries for companies in the $10M to $100M revenue range commonly run into the low-to-mid six figures annually. That number alone gives most mid-market business owners pause. But it is not the number that should drive the decision.

    Fully-loaded employment costs, covering benefits, payroll taxes, equity, and bonus expectations, add meaningfully on top of base salary, often by a third or more, though exact figures vary by benefits design. Add the recruiting burden on top of that, and you are looking at a substantially higher total commitment than the base salary alone before the new executive has reviewed a single vendor contract.

    Then comes the ramp period. Time-to-productivity for a new CIO hire involves a significant onboarding window. During that window, the business pays full compensation while the executive is still mapping vendor relationships, learning infrastructure history, and navigating internal politics.

    For a company in the Philadelphia corridor with $50M in revenue, a full-time CIO represents a material share of revenue in direct compensation alone, for a role that may genuinely require only 15 to 20 hours of strategic attention per week.

    How Fractional CIO Pricing Actually Works

    Fractional CIO engagements are priced as monthly retainers, and the structure is more tiered than most buyers expect.

    Entry advisory retainers ($4,000 to $6,000/month) cover advisory and governance functions: vendor review, IT roadmap development, and executive-level technology guidance at a defined weekly hour commitment. This tier suits businesses that need strategic direction and accountability but do not yet require hands-on operational involvement.

    Operational fractional retainers ($7,000 to $10,000/month) shift toward active engagement. At this level, expect direct vendor management, project oversight, IT team leadership, and representation in executive or board-level conversations. This is the most common entry point for mid-market companies that have an MSP relationship or internal IT staff but lack the leadership layer to direct either effectively.

    Embedded CIO engagements ($10,000 to $14,000/month) are appropriate for businesses in active IT transformation, compliance infrastructure buildout (HIPAA, SOC 2, CMMC), or technology integration tied to M&A activity. Scope and hours increase accordingly.

    Interim or transformation engagements ($14,000 to $20,000/month) address the most complex situations, including multi-site environments, regulatory overhauls, or post-acquisition integration work requiring near-full-time executive presence.

    That represents a 60 to 80 percent cost reduction compared to a fully-loaded full-time hire. The structural advantages extend beyond the price difference. An experienced fractional CIO arrives with vendor benchmarks, governance frameworks, and working knowledge of regional IT markets already in hand, none of which requires a ramp period to access.

    For businesses that have never had a formal IT leadership review, pairing a fractional engagement with an independent IT infrastructure assessment that surfaces what internal teams typically miss accelerates the ROI timeline considerably.

    The Cost Nobody Puts on the Spreadsheet: The IT Leadership Vacuum

    Knowing what a fractional CIO costs is only half the equation. The other half never appears on a budget spreadsheet.

    When a company operates without strategic IT leadership, those costs do not disappear. They accumulate silently across four categories that compound with every passing quarter.

    Infrastructure debt. Without an accountable technology leader reviewing architecture decisions, systems collect band-aid fixes and compatibility gaps that grow more expensive the longer they sit. In our experience working with mid-market companies across this region, this pattern is consistent among companies in the Exton and Philadelphia area that relied on reactive MSP support rather than proactive planning. A $15,000 remediation in year one becomes a $60,000 infrastructure overhaul in year three.

    Vendor and MSP misalignment. Companies without IT leadership oversight routinely pay for managed service contracts that were never renegotiated, carry redundant software licenses across departments, and have no leverage to enforce SLA accountability. MSP contract reviews routinely surface material overspend at companies in this revenue range, redundant licenses, unrenegotiated rates, and unenforceable SLAs add up faster than most finance teams expect.

    Deferred decisions. Every quarter a cloud migration, security review, or CRM consolidation goes unmade represents compounding risk exposure. A fractional CIO typically addresses these in a structured roadmap within 30 to 60 days of engagement.

    Project abandonment. IT initiatives without an executive owner stall. A failed ERP rollout or a compliance gap surfaced during audit carries costs that far exceed a full year of fractional engagement fees.

    Conservatively, a $30M company carrying unaudited MSP contracts, deferred infrastructure decisions, and a stalled initiative can accumulate leadership-gap costs well above the annual price of a mid-tier fractional engagement, without those costs appearing on any single budget line.

    A Practical ROI Framework for Evaluating a Fractional CIO Engagement

    Step 1: Calculate your fully-loaded baseline. Add up your current MSP contract costs, software licensing spend, and any IT project budgets that are stalled or over budget. This total is your denominator. It represents what you are already spending on technology operations without strategic leadership directing any of it.

    Step 2: Estimate your leadership gap cost across three line items.

    • Vendor overspend: What would a contract review likely surface? Use a conservative figure.
    • Deferred decision cost: Assign a dollar value to each major IT decision delayed more than one quarter. Factor in compounding risk, not just missed efficiency.
    • Project delay cost: Calculate sunk labor and timeline slippage on any stalled initiative.

    Step 3: Compare the gap cost against a retainer. Match the engagement tier to your company’s size and complexity. A $10,000/month retainer runs $120,000 annually. If your leadership gap cost exceeds that, the math already favors engagement.

    Step 4: Add the non-financial factors. How many hours per week is your CEO or COO currently absorbing IT decisions? What is your security and compliance exposure without oversight? Vendor accountability improvements compound quarterly. These items do not appear on the spreadsheet, but they have real cost consequences.

    Worked example: A 120-employee company near Lancaster or Reading, PA, with $40M in revenue and an unbenchmarked MSP relationship, could, in an illustrative scenario, recover the full cost of a $10,000/month retainer within a few months through vendor savings and project reactivation, a payback timeline consistent with what providers cite for typical engagements.

    Focus on payback period. The monthly retainer is a line item; the payback timeline is the actual decision metric.

    Fractional CIO vs. Full-Time Hire vs. Project Consulting: Which Fits Your Business

    Once the ROI math points toward fractional engagement, the remaining question is whether fractional is actually the right model for your situation, or whether a full-time hire or project consultant would serve you better.

    Full-time CIO is the correct answer as the organization scales toward enterprise complexity and daily executive IT presence becomes operationally necessary, where the role demands daily executive presence, board-level technology representation, and oversight of complex, multi-site IT environments.

    Project-based IT consulting fills discrete tactical gaps: a network assessment, a vendor evaluation, a security audit. What it does not provide is continuity. A consultant who delivers a report and exits does not own the outcome, does not govern your MSP relationship next quarter, and is not accountable when the recommendations stall in implementation.

    Fractional CIO sits between those two options and is the right fit for companies with 50 to 500 employees or IT budgets in the $500K to $5M range that already have an IT team or MSP relationship but lack the strategic layer to direct them, govern vendor spend, and translate technology decisions into business results.

    One important distinction: a fractional CTO (chief technology officer) is a separate role. The CTO owns product development and engineering leadership; the CIO owns business technology operations, infrastructure, vendor relationships, and IT governance. Companies researching options sometimes conflate the two, which leads to mismatched engagements.

    For mid-market businesses across the Philadelphia corridor, including Wilmington, Cherry Hill, and the western suburbs around Exton, proximity compounds the value. A fractional CIO familiar with regional compliance environments and local vendor markets reaches productive engagement faster than a remote generalist learning your context from scratch.

    What to Look For in a Fractional CIO Engagement Before You Sign

    Once you have identified the right fit for your business, the next step is evaluating whether a specific engagement is structured to deliver results. Not all fractional CIO arrangements are built the same way.

    Demand written scope. Before signing anything, require a documented engagement scope that specifies committed hours per week, named deliverables within the first 90 days, and explicit ownership of vendor relationships and IT governance decisions. Vague retainer language produces vague outcomes. If the agreement does not define what the fractional CIO owns, no one owns it.

    Verify vendor neutrality. A fractional CIO affiliated with or incentivized by specific technology vendors cannot give you objective advice on your MSP contract, your software stack, or your infrastructure roadmap. Confirm the engagement is fee-only and free of referral arrangements. The guidance you are paying for only has value if it is conflict-free.

    Confirm hands-on MSP experience. For most mid-market companies, the fastest ROI comes from cleaning up existing vendor relationships, not from abstract strategy work. Ask specifically whether the provider has benchmarked and renegotiated MSP contracts. Vendor consolidation is where measurable savings appear earliest; make sure the fractional CIO you hire has done it before.

    Require business-side credibility. The best fractional CIOs translate technology decisions into financial outcomes. They should be as comfortable presenting to your CFO or board as they are reviewing infrastructure architecture. If a candidate cannot frame an IT recommendation in terms of cost, risk, or revenue impact, they are not a strategic leader.

    Insist on flexible terms. Quarterly or month-to-month renewal structures protect you until the engagement has demonstrated value. A provider confident in their results will not require a 12-month commitment upfront.

    Orloff Phillips structures its fractional IT leadership engagements around MSP cleanup, vendor alignment, and infrastructure governance, with clear engagements and clear outcomes built in from day one. ROI visibility tends to arrive earlier than most buyers expect, often driven by vendor savings in the first engagement phase.

    The Honest Answer on Fractional CIO Cost and ROI

    As established above, the right comparison is not fractional retainer versus full-time salary, it is retainer versus the fully-loaded cost of the gap it fills.

    The numbers make this concrete:

    OptionAnnual Cost
    Full-time CIO (fully loaded)$250,000+ (salary, benefits, taxes, recruiting)
    Fractional CIO (scope-dependent)$60,000 to $180,000
    No IT leadership (hidden costs)Variable, MSP overspend, deferred decisions, and stalled projects accumulate without appearing on a single line.

    For businesses in Philadelphia, Exton, Wilmington, Cherry Hill, Lancaster, and Reading PA, the practical starting point is a vendor and MSP spend review. That review establishes your actual leadership gap baseline, and it gives you a defensible denominator before you price any engagement.

    The number that determines whether a fractional CIO engagement makes financial sense is not the monthly retainer. It is the payback period. For most mid-market companies, that period is measured in months, not years, and it is consistently shorter than they expect before they do the math.

    Conclusion

    The decision is straightforward once the right numbers are on the table: quantify your leadership gap, compare it to a retainer, and focus on payback period. If your business is carrying an IT leadership gap, a vendor and MSP spend review is the right place to start.

  • How IT Infrastructure Fragmentation Accumulates and Why It Is So Hard to See from the Inside

    How IT Infrastructure Fragmentation Accumulates and Why It Is So Hard to See from the Inside

    Most technology leaders do not wake up one day and decide to build a fragmented IT environment. They approve an acquisition. They greenlight a departmental software request. They authorize a cloud migration under deadline pressure. Each decision is rational, documented, and defensible. Yet over years, those individually sound choices compound into something that quietly undermines governance, security, AI adoption, and operational coherence across the entire organization.

    This is the paradox at the heart of IT infrastructure management: the very people closest to the environment are often the least equipped to see it clearly. When every decision made sense at the time, there is no obvious moment to point to, no single failure to investigate. The fragmentation is invisible precisely because it accumulated gradually.

    This analysis maps the specific patterns through which fragmentation builds, from acquisition-driven architecture debt and departmental tool sprawl to piecemeal cloud migrations and siloed identity systems. It explains why internal teams consistently miss the aggregate picture, how fragmentation surfaces as business symptoms rather than IT alerts, and what it takes to finally name and cost the pattern you are living inside.

    What IT Infrastructure Fragmentation Actually Means

    Most definitions of IT infrastructure treat it as a stack of layers: hardware, networking, software, data, and security. Vendor literature reinforces this view, describing each layer in isolation with its own maturity model and upgrade path. That framing is useful for procurement. It is useless for diagnosing fragmentation.

    Fragmentation is not a broken system. It is a coherence failure across systems that each work independently. Every application runs. Every database returns results. Every access policy enforces something. The problem is that none of them were designed in relation to each other, and the gaps between them are where operational risk, reporting error, and modernization failure quietly accumulate.

    This is a critical distinction from complexity. Complex infrastructure is manageable because its interdependencies are understood and governed. Fragmented infrastructure is structurally misaligned: the interdependencies exist, but no single architecture owns them. Complexity responds to good IT infrastructure management. Fragmentation resists it, because the problem is not scale or sophistication; it is the absence of a reconciling architecture across components that were each built or acquired on their own terms.

    Fragmentation concentrates in three domains. Data architecture is where competing schemas, disconnected warehouses, and duplicate records make a single version of business truth unreachable. ERP and operational systems are where acquisitions, upgrades, and workarounds leave organizations running parallel process logic with no authoritative source. Access control and identity is where personnel changes, acquired entities, and disconnected directories accumulate permissions that no one has fully audited.

    Because vendor literature addresses each domain separately, the cross-domain coherence failure remains invisible to teams working within any single layer. A security team can have excellent identity hygiene inside its own system while having no visibility into an acquired subsidiary’s directory. Each layer passes its own review. The aggregate fails silently.

    Mid-market businesses across Philadelphia, Wilmington, Exton, and Lancaster frequently encounter this pattern. Regional growth through acquisition and multi-site expansion is common in these markets, but post-acquisition IT rationalization is consistently under-resourced, producing inherited architectures that no one fully designed. This pattern of accumulating a bloated and misaligned technology stack through individually defensible decisions is the defining mechanism this post maps.

    Rational Decisions, Irrational Outcomes: The Accumulation Mechanism

    Recognizing fragmentation as a coherence failure is clarifying. What remains harder to accept is that no one caused it through negligence. The architecture that now resists change was built, decision by decision, by people making reasonable calls.

    This is the accumulation mechanism: fragmentation is not the residue of bad judgment. It is the aggregate output of individually defensible choices that were never reconciled into a unified architecture.

    Each decision type follows the same logic. An acquisition closes, and retaining the acquired company’s ERP avoids a costly, risky migration during a sensitive revenue integration period. A department purchases a SaaS tool because procurement cycles are too slow and the per-seat cost sits below the capital threshold that triggers IT review. A workload migrates to the cloud because one vendor offers a compelling cost reduction for that specific application. A second MSP is added because the first does not cover the geography of a new office. Every one of these decisions has a coherent business rationale. None of them is a mistake in isolation.

    The compounding effect is where the damage accumulates. Three such decisions made across three years produce an architecture that no single person designed and no single team owns. The acquisition team owned the first choice. The department head owned the second. A project manager owned the third. No one held the aggregate, because the aggregate was never the subject of a single decision.

    This pattern is structurally different from technical debt. Technical debt is deferred work: a known obligation postponed for later. Fragmentation is misaligned work: systems that each function correctly but were never designed to cohere. There is no backlog entry for it, because no one recognized it as a liability at the time of creation. This distinction matters when scoping remediation, and it is a gap that a structured external IT infrastructure audit is specifically designed to surface.

    The damage curve follows a predictable pattern: fragmentation in enterprise data systems rarely produces immediate failure. Instead, competing data versions erode governance and reporting confidence incrementally, long before any system visibly breaks. By the time leadership notices, the problem is years old.

    Acquisition-Driven Fragmentation: When Growth Creates Architecture Debt

    Of all the accumulation patterns, acquisition-driven fragmentation is the most structurally entrenched because it arrives with a ready-made justification: the deal closed, revenue is integrating, and IT can follow later.

    It rarely does.

    When a company is acquired, its technology stack comes with it: a legacy ERP that encodes years of operational logic, an identity and access control system built around its own org chart, cloud tenancies provisioned under its own billing accounts, and frequently its own MSP relationship managing day-to-day support. IT due diligence guidelines explicitly flag this inherited technical debt as a pre-close risk, yet reconciliation is routinely deferred post-close because the cost and timeline are unattractive against the revenue integration timeline.

    The business case logic is straightforward: consolidating two ERPs is expensive, disruptive, and slow. Integrating the sales pipeline and customer accounts is faster and more visible to leadership. So IT reconciliation gets pushed to the next planning cycle, then the one after that. The acquired company’s MSP contract renews. The cloud tenancy stays active. The data schema remains separate. All three persist, not because anyone decided they should, but because no one made the decision to eliminate them.

    Access control is where this deferral carries the most direct risk. IT integration guidance identifies identity and access management as a key post-merger risk area. Organizations managing two disconnected identity systems cannot reliably audit who has access to what across the combined entity. Access rights granted under the acquired company’s policies persist under the acquirer’s infrastructure, often without visibility.

    Regional mid-market companies in Cherry Hill, Reading, and Lancaster are common examples of this dynamic. Growth through acquisition is common in these markets; dedicated post-acquisition IT rationalization programs are not. The result is an architecture that expands with each deal and consolidates with none of them.

    Departmental Tool Sprawl and the Shadow IT Infrastructure Problem

    Acquisitions introduce fragmentation through discrete, visible events. Departmental tool sprawl works differently: it accumulates invisibly, one low-cost SaaS subscription at a time, through a governance structure that makes each purchase entirely legitimate.

    The mechanism is straightforward. Most organizations set a capital expenditure threshold above which IT review is required. The modern SaaS market prices products well beneath that ceiling. A sales team subscribes to a prospecting tool, a marketing team adds a reporting platform, an operations team adopts a workflow application. Each purchase clears the approval process without triggering an architecture review. No single decision is wrong. The aggregate is a parallel data infrastructure that no one formally sanctioned.

    The data consequence is what makes this pattern costly. Sales exports pipeline data from its CRM integration. Finance pulls revenue figures from its own reporting layer. Operations tracks fulfillment through a separate workflow tool. All three outputs can be technically accurate within their respective systems and still produce numbers that cannot be reconciled. Leadership meetings devolve into arguments about which figure is correct, when the real problem is no single authoritative source exists. This is an IT infrastructure management failure, not a departmental behavior problem.

    That distinction matters. Shadow IT is broadly recognized as a growing organizational problem, but blaming employees for adopting tools that work misses the root cause. Departments buy outside the governance process because the official process is too slow to meet their operational pace. Shadow IT signals that the core IT infrastructure management function is not serving departmental needs at the speed the business requires.

    The compounding problem is structural. Many of these tools integrate natively with each other but not with the ERP. Over time, they form a second-tier data layer that other workflows begin to depend on. Removing any single tool breaks downstream processes. The informal stack has become load-bearing infrastructure, and cleaning it up carries the same risk and cost as touching a core system. Organizations that recognize this early are in a far better position than those who discover it mid-modernization; the latter often find, as covered in assessments of when an MSP relationship is costing more than it saves, that fragmented vendor and tool relationships share the same structural root.

    Piecemeal Cloud Migrations and the Multi-Tenancy Trap

    Each cloud migration was individually justified, and none were reconciled into a coherent whole.

    The typical sequence begins with a single workload, a file server, a backup system, a development environment, moved to the cloud to solve a specific problem. Cost reduction, a vendor incentive, a performance bottleneck, or a team initiative all produce the same outcome: one workload migrated, one new cloud tenancy opened, one governance boundary created that did not exist the week before.

    The incompatibility accumulates across tenancies, not within them. When a second workload migrates a year later, often through a different vendor with a different contract structure, it lands in a separate environment with its own identity controls, its own logging configuration, and its own access policies. Neither environment was designed to operate alongside the other. A third migration, a fourth, each legitimate, produces the same result: multiple cloud architectures with no unified governance layer connecting them.

    This is the multi-tenancy trap. The individual environments function correctly. The gap is between them, and that gap has no owner.

    The data movement problem compounds the governance gap. Workloads frequently migrate without their full data context. Reporting pipelines that assumed co-located data suddenly require custom integration bridges to pull information across environment boundaries. Those bridges are built to solve an immediate problem, then quietly become permanent. Each one represents ongoing maintenance that was never budgeted and rarely documented.

    The result is a reporting architecture built on improvised connectors rather than intentional design, and every connector is a dependency that will surface during the next migration or upgrade attempt.

    In IT infrastructure consulting engagements, Orloff Phillips routinely opens with a cloud environment audit before reviewing anything else. For businesses across the Philadelphia, Wilmington, and Exton markets, that audit consistently surfaces multiple distinct cloud environments that the organization’s own IT team cannot fully account for, each with separate contracts, separate governance assumptions, and no reconciling architecture across them.

    Why Internal Teams Cannot See the Fragmentation Pattern

    What makes fragmentation durable is not its complexity but the organizational blind spots that prevent it from being seen as a unified pattern.

    Institutional memory distributes the gap across people. The director who negotiated the original MSP contract may have left two years ago. The team that ran the ERP implementation is dispersed. The person who authorized the acquired company’s cloud tenancy never joined the parent organization’s IT leadership. No single person was present for all the decisions, so no single person holds the complete picture. This is not negligence; it is the structural consequence of decisions made across years and personnel changes.

    Standard IT infrastructure management processes compound the problem. Those processes were designed to operate existing systems reliably, not to audit whether the architecture across those systems is coherent. Ticketing systems, change management workflows, and vendor SLAs each address a discrete system in isolation. None of them surface the question: does the sum of these systems constitute a governable architecture?

    The result is what researchers describe as a gradually boiling water effect. Fragmentation accumulating over five years produces no single crisis moment, only a slow erosion of governance confidence, reporting reliability, and the organization’s capacity to modernize. Leadership begins to distrust data outputs. Projects surface unknown dependencies. Initiatives stall without a clear cause.

    Research reinforces this blind spot from another angle: organizations consistently prioritize technical challenges such as data quality and model performance before defining underlying business objectives. This sequencing error is a symptom of not seeing the architecture problem clearly. When the root cause is invisible, teams treat downstream symptoms as the primary problem, and investments stay misaligned.

    This is precisely where the value of an outside perspective becomes structural rather than optional. A fractional CIO or part-time technology executive enters without the rationalization narrative embedded in institutional memory, which is what makes the aggregate visible for the first time.

    How Fragmentation Surfaces as Business Symptoms, Not IT Problems

    The sharpest current signal of hidden fragmentation is the AI pilot stall.

    The AI stall is the sharpest current signal. Only roughly one-third of organizations have moved AI initiatives beyond the pilot stage into genuine production deployment, despite the overwhelming majority now using AI in at least one business function. The instinct is to blame model quality, tooling gaps, or organizational readiness. The structural cause is more fundamental: fragmented data architecture means there is no coherent data layer for AI systems to operate against. Models trained on misaligned, inconsistently governed data produce outputs that are technically plausible but contextually unreliable. The pilot works in a controlled environment; it fails to scale because the underlying data environment was never unified. If your organization has technology that feels harder to use than it should, stalled AI pilots are often the most visible expression of that friction.

    Competing data versions erode executive confidence in a specific, compounding way. When finance produces one revenue figure for a quarter and operations produces a different one from the same period, leadership does not simply resolve the discrepancy. Over time, leadership stops trusting the data layer entirely. Decisions migrate toward instinct or informal consensus, which compounds the cost of fragmentation well beyond the IT organization.

    Modernization projects surface the hidden architecture. Teams scoping ERP upgrades or platform migrations routinely discover dependencies that were not documented because no one mapped the full architecture. Projects that were scoped at six months run twelve. Budgets expand. The dependency was always there; it only became visible when someone tried to change something.

    Security exposure follows the same invisible accumulation pattern. Access rights granted during an acquisition or a personnel transition persist in disconnected identity systems long after the business context that justified them is gone. No single event creates the exposure; it accumulates quietly across every unreconciled identity boundary.

    The External Frame: What IT Infrastructure Consulting Reveals

    Recognizing fragmentation as a business problem is only half the work. The harder step is understanding why internal teams, despite their competence, cannot resolve it on their own.

    What external IT infrastructure consulting maps that internal audits cannot is the full accumulation sequence across vendor relationships, MSP boundaries, and integration dependencies.

    That sequence reveals which decisions were made, in what order, under what business pressures, and what each one cost relative to what a reconciled architecture would cost today. This class of problem is structural, requiring architectural perspective rather than component-level review. Internal audits are designed to assess whether existing systems are functioning. They are not designed to evaluate whether the architecture those systems compose is coherent.

    The distinction between technical remediation and strategic fragmentation diagnosis is direct. Technical remediation fixes a failing component; it replaces the legacy server, patches the integration, upgrades the ERP module. Strategic diagnosis names the architecture problem above those components, costs the current state against a rationalized alternative, and produces a decision framework for sequenced investment. Without that diagnosis, remediation efforts address symptoms while the structural misalignment persists.

    Orloff Phillips approaches fragmentation diagnosis for businesses across the Philadelphia, Exton, and Wilmington markets by starting with vendor and MSP relationships rather than the technical architecture itself. Vendor contracts, MSP scope boundaries, and integration dependencies reveal actual architecture state more accurately than internal documentation, which is typically incomplete or outdated. The architecture surfaces through the relationships, not the other way around.

    The business case is direct: organizations that quantify fragmentation costs before launching modernization initiatives avoid investing in the wrong layer. Most modernization failures trace to misaligned investment, not insufficient budget. External diagnosis closes that gap before it becomes expensive.

    A Diagnostic Checklist: Recognizing Fragmentation in Your Own Environment

    Review each symptom against your current environment. Answer honestly, not aspirationally.

    Your business IT infrastructure is managed by more than one MSP or contracted vendor, with no single party accountable for the whole. Each vendor manages its own scope and escalates nothing horizontally. Gaps between scopes go unmanaged by default.

    Reporting outputs from different departments regularly produce different numbers for the same metric and the same time period. Finance and operations each have a defensible methodology. Neither is wrong in isolation. The architecture is wrong because it produces two versions of the same fact.

    AI or analytics initiatives have been in pilot for more than six months with no defined path to production deployment. This is not a model problem or a tooling problem. Pilots stall when the underlying data architecture cannot support consistent, governed inputs at scale. The pilot works; the foundation does not.

    Your cloud environment contains workloads migrated at different times, governed under different contracts or tenancies, with no unified oversight layer. Each migration was individually justified. Together, they produced an environment no single team can fully account for or govern coherently.

    Identifying access rights for departed employees, acquired-company users, or legacy system accounts requires a manual audit because no unified identity system exists. This is not a housekeeping issue. It is a documented security exposure that compounds with every acquisition, personnel change, or system addition that goes unreconciled.

    ERP upgrade or platform migration projects consistently surface unknown dependencies that were not in the original project scope. Scope creep of this kind is not a planning failure. It is evidence that the architecture was never fully documented, because no single team held the complete picture at one time.


    How to Use This Checklist

    One symptom may reflect an isolated gap. Two may reflect a pattern under control. Three or more symptoms present simultaneously indicate that fragmentation has passed the threshold where internal management alone can resolve it.

    At three symptoms, the architecture has accumulated enough misalignment across enough domains that a coherent remediation path requires an external frame. Internal teams can fix individual components; they cannot redesign the accumulation sequence from inside it. That distinction is precisely what an external architecture review is structured to provide.

    Conclusion: Naming the Pattern Is the First Step Toward Resolving It

    If the checklist surfaces three or more symptoms, the productive response is recognition, not alarm.

    The first move is diagnosis, not remediation. Remediation without diagnosis produces the same compounding problem at a higher cost. The correct starting point is mapping the accumulation sequence: which decisions created which layers, what those layers currently cost to maintain, and what a reconciled alternative would cost instead. That comparison creates the business case. Without it, modernization initiatives tend to address symptoms rather than the structural misalignment underneath them.

    Orloff Phillips works with businesses in this region to do exactly that work. The engagement begins with vendor and MSP relationships, surfaces the architecture those relationships have produced, maps the accumulation sequence, and builds the cost comparison that internal teams cannot build objectively. Vendor alignment, MSP consolidation, and strategic infrastructure rationalization are not parallel tracks; they are sequential steps in a coherent diagnosis-to-resolution process.

    The organizations that modernize fastest are rarely those with the cleanest starting point. They are the ones who invested early in understanding precisely where they were. Clarity about the current state is not a preliminary. It is the strategic advantage that makes every subsequent decision faster, cheaper, and more likely to hold.

  • How to Benchmark Your MSP Before You Decide to Fix or Replace Them

    How to Benchmark Your MSP Before You Decide to Fix or Replace Them

    Something feels off with your managed service provider. Tickets are taking too long. Issues keep recurring. Your team is losing patience. But here is the problem: frustration is not a strategy, and a gut feeling will not win a renegotiation or justify a costly provider switch.

    Before you make any move, you need vendor performance metrics that convert suspicion into documented, defensible evidence. The businesses that enter MSP reviews armed with objective data consistently negotiate better outcomes, whether that means holding their current provider accountable or confidently transitioning to a new one. Those that rely on anecdote alone risk trading one dysfunctional relationship for another.

    This guide walks you through a structured, step-by-step benchmarking process. You will learn how to audit SLA attainment against industry thresholds, measure ticket resolution times and escalation rates, calculate your cost-per-device against market standards, and build a scorecard that supports any decision you make. By the end, you will have the framework to answer one critical question with clarity: should you fix the relationship you have, or replace it entirely?

    Why Frustration Is Not a Benchmark

    “They never respond on time.” “We’re always chasing them.” “Nothing ever gets fixed.” These complaints are legitimate, but they are not a benchmark. When you walk into an MSP renegotiation or exit conversation armed only with frustration, you hand your provider exactly what they need to stall: the ability to call your concerns subjective.

    A provider can dismiss a complaint. They cannot dismiss documented ticket data showing average acknowledgment times beyond 4 hours when the industry standard for best-in-class is 15 to 30 minutes (Evolved Management, MSP Service Metrics). The difference between those two conversations is not tone; it is evidence.

    Without objective vendor performance metrics, you also lose the ability to diagnose accurately. A provider struggling with staffing turnover in one tier presents very differently in the data than a provider whose entire service model is structurally reactive. The fix for the first is targeted. The fix for the second may not exist. Benchmarking tells you which problem you actually have before you commit to a path.

    Replacing an MSP without that diagnostic carries its own risk. Businesses that leave a failing provider without ever defining what “good” looks like often reproduce the same failure in the next contract. They selected on price or familiarity and skipped the performance criteria entirely. If you are already recognizing the signs that your MSP is costing you more than it’s saving, the next step is measurement, not replacement.

    The 2026 MSP market tracks performance across 30+ measurable KPI categories, covering everything from SLA compliance and resolution time to security metrics and customer satisfaction. Your provider’s platform almost certainly captures this data already. Requesting it is not adversarial; it is a standard part of strategic vendor management.

    A structured benchmarking process converts suspicion into a defensible record. That record gives you leverage in every direction: renegotiate from a documented position, exit with documented cause, or continue the engagement with formal accountability in place.

    What to Gather Before You Start

    Before any analysis is possible, you need five specific inputs in hand. Attempting to benchmark your MSP without them produces opinions, not evidence.

    1. Ticket history export (trailing 90 days)

    Contact your MSP and request a raw data export from their ticketing platform covering the last 90 days. The export must include ticket open time, first response time, resolution time, and priority classification for every ticket. Summary dashboards are not sufficient; filtered reports can exclude closed-without-resolution tickets that materially affect your actual metrics. If your provider resists providing raw data, note that refusal in writing.

    2. Your signed contract with SLA commitments highlighted

    Pull your current MSP agreement and read every SLA clause. Identify response time guarantees by priority tier, escalation triggers, and any remediation language for missed SLAs. Many businesses discover at this stage that their “SLAs” were never formally defined in the contract, meaning they have been measuring against informal expectations rather than enforceable obligations. That distinction changes every conversation that follows.

    3. CSAT results and survey methodology

    Collect any satisfaction feedback your MSP has shared with you. Note specifically how the survey was delivered and what response rate was achieved. A traditional email survey with a sub-5% response rate carries far less statistical weight than a one-click system generating 15 to 40% response rates. If your provider has never shared CSAT data, that gap belongs in your documentation before you go further.

    4. Your current invoice, itemized

    Document your monthly fee broken down by device count, seat count, and service tier. This is the foundation for calculating a cost-per-device figure, which you will use later as a unit-economics comparison across any incoming proposals.

    5. A recurring issue log by category

    List the issues your team raises most frequently, grouped by type: network, endpoint, security, or application. This lets you cross-reference ticket volume against infrastructure category later in the process, which separates a performance problem from an infrastructure problem.

    If you want guidance on how to structure this intake process, a live conversation on real execution is the fastest way to identify what you already have and what still needs to be requested.

    Step 1: Audit SLA Attainment Against Industry Thresholds

    With your ticket export and contract in hand, the first measurement to run is SLA attainment, and it requires two simultaneous comparisons, not one.

    Set Your Dual Benchmark

    Best-in-class MSPs acknowledge tickets within 15 to 30 minutes; beyond 4 hours is a documented failure threshold, compare your actual data against both your contract and that market standard simultaneously.

    This dual comparison matters because a provider can be technically compliant and still below market standard. If your contract guarantees 4-hour acknowledgment and your provider hits that number, they are meeting the letter of the agreement while operating at the floor of acceptable performance. Both facts belong in your documentation.

    Check for Priority Tiering

    A properly structured SLA framework applies distinct response clocks to different ticket types. A P1 (critical outage affecting business operations) and a P3 (password reset for a single user) should never share the same SLA timeline. Any provider treating all tickets identically is not running a defensible SLA framework; they are running a queue.

    Review your ticket export for priority classification. If every ticket carries the same priority designation, or if priority fields are blank, that structural gap is itself a performance finding.

    Calculate Your Attainment Rate

    Divide the number of tickets resolved within the contracted timeframe by total tickets in the trailing 90-day period, then multiply by 100. An attainment rate that falls materially below your contracted commitment warrants formal written documentation directed to your provider, not a verbal conversation.

    Keep this calculation separate for each priority tier if your data supports it. A 95% overall attainment rate can mask a 70% attainment rate on P1 tickets.

    Establish a Monthly Review Cadence

    Strategic vendor management requires SLA review monthly, not at annual renewal. If your provider has never delivered a monthly performance report, that absence is a data point. A provider who tracks this data has no operational reason to withhold it.

    Step 2: Measure Ticket Resolution Time and Ticket-Per-Seat Ratio

    SLA attainment tells you whether your provider is meeting its commitments on paper. Ticket resolution time and ticket volume tell you whether those commitments are actually protecting your business.

    Resolution Time Benchmarks

    Best-in-class average time to resolution is 30 to 60 minutes. Reactive tickets that consistently exceed 4 hours are a documented signal that your provider is responding to failures rather than preventing them, and that pattern requires immediate written review, not a note for the next quarterly call.

    Pull your ticket export from Step 1 and calculate your average resolution time across all tickets in the trailing 30 days. Then break that number down by category: hardware, software, network, security, and user error. A slow average driven entirely by hardware tickets has a different explanation than slow resolution spread uniformly across all categories. The first may indicate a dispatch or parts-sourcing problem; the second points to technician depth or process failures. The remediation path is different in each case, so do not treat the categories as interchangeable.

    Ticket-Per-Seat Ratio

    Divide your total ticket count for the past 30 days by your total managed seat count. The industry average is approximately 1 ticket per seat per month. Best-in-class providers deliver around 0.5. A ratio above 4 tickets per seat per month indicates a systemic infrastructure or process problem, and your MSP should be identifying and eliminating the root causes, not simply closing the resulting tickets.

    This ratio is the clearest single indicator of whether your provider is managing your environment proactively or reacting to it. A well-managed environment generates fewer tickets over time. A poorly managed one generates more.

    A Note for Regional Businesses

    For businesses in Exton, Philadelphia, Wilmington, Cherry Hill, Lancaster, and Reading, PA, hardware ticket resolution time is directly affected by whether your provider can dispatch a technician on-site. Ask specifically whether the resolution benchmarks your provider publishes reflect remote-only resolution or include physical dispatch. A provider without local on-site capability will carry a structural disadvantage on hardware tickets that no remote tooling fully compensates for.

    Step 3: Assess CSAT Scores and Escalation Rates

    Resolution time and ticket volume tell you whether your MSP is keeping up. CSAT scores and escalation rates tell you whether the work they are completing is actually landing well, and whether their team is equipped to handle what you are sending them.

    CSAT thresholds are not subjective. The industry target is greater than 85% positive feedback. Industry leaders consistently exceed 95%. Any provider operating below 85% is delivering a measurably substandard client experience, and that number belongs in your scorecard regardless of how pleasant your account manager is to deal with.

    Before you accept any CSAT figure at face value, ask how the survey was delivered and what response rate it achieved. Recall the response-rate gap noted earlier: one-click systems yield 15–40% feedback versus sub-5% for traditional surveys, that difference determines whether the number your provider shares is statistically meaningful.

    If your MSP cannot tell you their survey delivery method and response rate, you are not evaluating CSAT data. You are evaluating a number without a denominator, and that gap belongs in your documentation.

    Escalation rate is the second metric to pull from this category. It is the percentage of tickets requiring involvement beyond the first-line technician. An occasional escalation is normal. A rising rate is a signal, and the cause determines the remedy.

    A spike in escalations following a staffing change at your provider points to a bench depth problem. That is your provider’s issue to fix. A gradual escalation rate climb that tracks closely with new applications or infrastructure you have deployed points to a complexity mismatch. In that case, the question is whether your provider can grow with your environment or whether they have already reached their operational ceiling.

    Track escalation patterns broken down by ticket category and by time period. Both dimensions matter for diagnosis.

    Step 4: Calculate Cost-Per-Device Against Market Benchmarks

    With CSAT and escalation data captured, the next calculation shifts from service quality to financial accountability.

    Divide your total monthly MSP invoice by your total managed device count. That single figure, your cost-per-device, is the foundational unit economics metric that makes vendor performance comparable across providers regardless of contract structure. A flat-fee agreement, a per-seat arrangement, and a tiered model all collapse into the same number once you run that calculation.

    National per-device pricing varies widely by service tier and market, making like-for-like competitive quotes the most reliable comparison point. Businesses in the Philadelphia metro corridor, including Exton, Wilmington, Cherry Hill, and Lancaster, operate in a market with enough provider density to obtain two or three competitive quotes within a reasonable sourcing window. Use those quotes as your benchmark. Like-for-like proposals covering the same device types, service tiers, and included tooling are the only valid comparison.

    The most defensible case for renegotiation is a high cost-per-device paired with a high ticket-per-seat ratio. Paying at or above market rate while generating 4-plus tickets per seat per month gives you documented evidence of both overpricing and underperformance simultaneously. That combination is difficult for any provider to argue against in writing.

    Before accepting your cost-per-device figure at face value, examine your contract for bundled versus itemized services. Many MSP agreements fold security tooling, remote monitoring platforms, and backup solutions into a single flat rate. Bundling is not inherently problematic, but it can obscure whether you are receiving each service at the level contracted. A provider billing for endpoint detection and response within a bundle but deploying it inconsistently costs you money without delivering the protection.

    Request a complete itemized breakdown of what your monthly fee covers. A well-run provider produces this without friction. If yours cannot or will not, log that refusal in your documentation file. Service opacity is also worth examining through the lens of how a bloated or poorly structured technology stack accumulates over time, often without any single decision being the obvious cause.

    Step 5: Evaluate Relationship Health and Strategic Alignment

    Cost-per-device tells you what you’re paying. This step tells you what you’re getting for it beyond ticket closure.

    Quantitative benchmarks measure execution. Strategic vendor management requires a second assessment: whether your provider is building toward where your business is going, not just maintaining where it has been.

    Test communication responsiveness outside the ticket system. Send your account manager a direct question about your environment and measure how long a substantive, informed reply takes. A useful account manager knows your infrastructure well enough to answer without escalating internally. If responses are slow, generic, or routed through the helpdesk queue, that signals a relationship operating at arm’s length.

    Audit proactive output from the past 12 months. Has your provider delivered a technology roadmap recommendation, a documented security posture review, or a budget planning discussion unprompted? These are baseline indicators of a strategic partnership. A provider whose only output is closed tickets is functioning as a reactive help desk, not a managed services partner. That distinction matters under any clear engagements, clear outcomes framework you apply to vendor relationships.

    Verify environment documentation. Request a current network diagram, asset inventory, and runbook. If your provider cannot produce all three, that is not a service gap; it is a retention mechanism. Undocumented environments make transitions expensive and create real security exposure. An IT infrastructure assessment often surfaces documentation deficiencies that internal teams have never seen because the MSP controlled the record.

    Apply a regional growth lens. For businesses expanding across Exton, Philadelphia, Wilmington, and Reading, PA, strategic alignment means your outsourced IT provider should be an active voice in decisions about scaling infrastructure, opening new locations, and meeting compliance requirements specific to your industry. If that contribution is absent, your provider is not aligned with your trajectory regardless of what their SLA numbers show.

    Step 6: Build Your Defensible Scorecard

    With your qualitative findings from Step 5 now alongside your quantitative data, you have everything needed to build a single document that converts scattered observations into structured evidence.

    Consolidate all five steps into one scoring table. For each metric, SLA attainment rate, average acknowledgment time, average resolution time, ticket-per-seat ratio, cost-per-device, CSAT score, and escalation rate, record three values side by side: the industry benchmark, your provider’s actual performance, and a red/yellow/green status. Green means at or above benchmark. Yellow means below benchmark but within a correctable range. Red means a documented, material performance failure.

    Attach supporting evidence to every red-status metric. A score without a source is an opinion. For each red item, attach the specific proof: ticket screenshots with timestamps, the contract SLA language that was breached, invoice line items showing cost, and any written exchange where you raised a concern and how your provider responded. This documentation layer is what separates a scorecard from a complaint.

    Understand the three functions this document serves. First, it gives you negotiating leverage; a provider cannot dismiss a table showing 62% SLA attainment against a contractual commitment. Second, where your agreement includes a termination-for-cause clause, documented performance evidence supports invoking it. Third, it protects your reputation; if a provider characterizes you as a difficult client during a transition, dated documentation of how you raised concerns professionally is your counter-record.

    Date every piece of evidence and anchor it to a consistent 90-day measurement window. A single bad month is an outlier. Ninety days of consistent underperformance is a pattern, and providers cannot credibly claim otherwise when timestamps tell the story.

    If you bring in an advisory firm like Orloff Phillips, this scorecard becomes the input for an independent assessment. Third-party validation of your findings carries more weight in any renegotiation or transition than internal documentation alone, because it removes the appearance of bias from the record.

    Step 7: Apply the Fix-or-Replace Decision Framework

    With your scorecard complete, the data answers the question you came here to ask.

    Two or fewer red-status metrics, a pattern of responsiveness to written concerns, and a history of proactive communication points toward renegotiation. The relationship infrastructure exists. The provider has demonstrated it can receive feedback and act on it. A structured performance improvement agreement, with monthly SLA reviews and written accountability checkpoints, is a reasonable next step before initiating a search.

    Three or more red-status metrics, silence in response to documented concerns, and an undocumented environment points toward replacement. The structural conditions for improvement are absent. A provider that has not responded to written performance concerns has already told you what a renegotiation will produce.

    If replacement is the direction, do not lower the standard when evaluating candidates. Use your scorecard benchmarks as the evaluation criteria in every incoming proposal. Require candidates to submit published CSAT scores, ticket-per-seat ratios, and average resolution times as part of the RFP. A provider unwilling to share those figures before signing a contract is unlikely to report them transparently after.

    Transition risk deserves direct acknowledgment. Switching outsourced IT providers without a documented environment and a structured handoff plan routinely costs more in productivity loss than tolerating a mediocre provider for an additional six months while executing a clean exit. The cost calculus favors a planned transition over a reactive one, particularly when your environment is undocumented and the outgoing provider controls institutional knowledge.

    The fix-or-replace decision is also not always binary at the contract level. Some engagements benefit from a parallel period where an incoming provider shadows the existing one, absorbing environment knowledge before the cutover. For businesses in the Philadelphia and Wilmington metro areas, regional IT talent density makes this model practical; the provider pool is deep enough to support a structured overlap without requiring a national search or extended timelines.

    Common Mistakes That Undermine the Benchmarking Process

    Even a well-structured decision framework produces flawed conclusions if the underlying data is compromised. Before you finalize any scorecard or act on your findings, confirm you have not made any of these common errors.

    Benchmarking only during a crisis. Data collected during an active outage or a high-tension incident will skew every metric. Response times slow, escalation rates spike, and CSAT plummets for reasons that may not reflect steady-state operations. Always measure across a consistent trailing 90-day window that captures normal workload conditions alongside any incidents, so the picture reflects your environment as a whole.

    Accepting provider-generated reports without validation. Request the raw ticket export described in Step 1 rather than accepting filtered summary dashboards; if your provider refuses, log it.

    Comparing price instead of value. Cost-per-device means nothing without the performance metrics from Steps 2 and 3 alongside it.

    Skipping the contract review. If you skipped the contract review in the preparation step, do it now, undefined SLAs change every conversation that follows.

    Failing to involve end users. Executive perception of MSP performance and the daily experience of employees submitting helpdesk tickets frequently diverge. Poll the people who interact with the helpdesk regularly. Their input will surface patterns, such as repeated workarounds or avoided tickets, that raw data alone will not show.

    Turn Your Evidence Into a Decision You Can Defend

    Avoiding the common pitfalls covered above gets your data clean. What you do with that data determines whether your benchmarking work has any real force behind it.

    The seven steps in this guide are a repeatable management discipline, not a one-time diagnostic. Run the full cycle once to establish your baseline, then treat monthly SLA attainment review as the minimum ongoing cadence. A single data point is an incident; twelve months of data is a pattern, and patterns are what hold up in a renegotiation conversation or a contract exit.

    The thresholds established in Steps 1–3, 15–30 min acknowledgment, 30–60 min resolution, 85–95% CSAT, and approximately 1 ticket per seat per month average, are current industry standards, not stretch targets. Note that 0.5 tickets per seat is best-in-class; approximately 1 ticket per seat per month is the industry average.

    Documented evidence protects your business regardless of which direction you move. It gives you leverage in a renegotiation, grounds for invoking a termination clause, and a formal accountability structure if you choose to continue the relationship with new performance expectations written in.

    For businesses in the Exton, Philadelphia, Wilmington, Cherry Hill, Lancaster, and Reading PA area, Orloff Phillips provides independent vendor evaluations and structured transition support when internal teams need an objective outside perspective. The firm brings a repeatable methodology to engagements where the stakes are too high for guesswork.

    The process starts with a single step. Let’s start a conversation to schedule a vendor performance review, or request a scorecard template to begin building your evidence file this week.

    Conclusion

    Replacing or retaining your MSP should never come down to gut feeling or accumulated frustration. This process works because it replaces emotion with evidence, giving you a defensible position no matter which direction you move.

    The core takeaways are straightforward: know the industry benchmarks before you evaluate, document performance gaps with specificity, build a scorecard that separates fixable problems from fundamental misalignment, and apply a structured decision framework before signing or canceling anything.

    Businesses that complete this process walk away with one of three outcomes: a stronger contract, a productive renegotiation, or a clean and justified transition. All three are better than staying stuck.

    Your MSP relationship is one of the most consequential vendor decisions your business makes. Treat it accordingly. Start your evidence file this week, and make the next decision one you can fully stand behind.

  • Fractional CIO Services Explained: What a Part-Time Technology Executive Actually Does for Your Business

    Fractional CIO Services Explained: What a Part-Time Technology Executive Actually Does for Your Business

    Most companies exploring fractional CIO services enter the conversation with the wrong mental model. They picture a seasoned IT professional who shows up two days a week, manages vendors, and keeps the lights on. That picture is not just incomplete; it leads directly to misaligned expectations, underutilized engagements, and, ultimately, wasted spend.

    A fractional CIO is an executive function, not a staffing solution. The distinction carries real operational consequences: who owns the technology roadmap, who governs vendor relationships, who speaks to the board on technology risk, and how authority is structured when decisions need to be made under pressure.

    This post cuts through the noise to give you a working definition built on decisions, deliverables, and cadence rather than a vague job description. You will learn exactly where the fractional CIO scope begins and ends, how it differs from an IT manager or project consultant, what the first 90 days actually look like, and which questions to ask before signing an engagement. Whether you are evaluating this model for the first time or trying to determine whether your current setup is delivering executive-level value, the analysis that follows gives you the framework to find out.

    The Misconception That Costs Companies Before the Engagement Starts

    That mental model — a senior IT professional who shows up part-time to manage vendors — is wrong in a specific way. The problem is categorical, not cosmetic. When an organization frames a fractional CIO as reduced-cost IT management, it purchases the role against operational criteria: responsiveness, ticket escalation, vendor coordination. Those are legitimate operational needs. They are also not what a fractional CIO is for. The result is a mismatch in deliverables, accountability, and ultimately ROI, because the company is measuring executive-level strategic output against a help desk standard.

    Fractional CIO meaning is not determined by hours on-site. It is determined by the altitude of decisions owned. A fractional CIO sets technology strategy, governs vendors against business outcomes, owns the IT investment recommendation, and reports on technology risk at the board level. Those functions exist above the operational layer entirely, regardless of whether the engagement is two days a week or two days a month.

    Companies that conflate fractional CIO services with outsourced IT management tend to end up with exactly that: a well-credentialed vendor contact who surfaces escalations and produces slide decks, rather than an executive who owns the decisions shaping the company’s technology trajectory.

    The distinction matters most before the engagement starts. Organizations that understand what they are actually buying can structure the engagement correctly, define the right success metrics, and extract strategic value from day one. Those that don’t add a line item and wonder why nothing changed.

    What Is a Fractional CIO: A Working Definition Built on Decisions, Not Hours

    A fractional CIO is a part-time executive who owns strategic IT decisions for an organization on a defined engagement model. The operative word is owns. This is not a contractor executing tasks at a reduced hourly rate; it is an executive function with genuine decision authority.

    That authority covers four domains: technology roadmap ownership, vendor selection and governance, IT budget recommendations, and board-level reporting on technology risk and investment. A fractional CIO authors the multi-year plan connecting IT to business objectives, governs the vendors executing against it, translates IT spend into investment logic the CFO can evaluate, and briefs the board on technology risk in terms that drive decisions rather than fill agenda slots. That strategic ownership is the foundation on which vendor governance, budget accountability, and board reporting all rest.

    Fractional describes the engagement structure, not the commitment to outcomes. The scope is calibrated to what the organization currently needs rather than a full-time salary and benefits package. The strategic altitude of the work does not change; the organizational footprint does.

    Peer-reviewed research published in Information Systems and e-Business Management identifies fractional CIO adoption as an emerging model in SMEs, documenting multiple distinct engagement types including strategic IT management, restructuring, rapid scaling, and hands-on support. The same research notes that most SMEs lack the resources to employ a full-time CIO, yet executive-level technology leadership is a material factor in competitive performance. Failing to assign strategic IT responsibility to a qualified executive produces reduced performance and lost business value.

    This is precisely the structural problem facing mid-market businesses across Philadelphia, Exton, Wilmington, Cherry Hill, Lancaster, and Reading, PA. These organizations face genuine CIO-level challenges: vendor sprawl, technology debt, security risk, and growth-stage infrastructure decisions. But a full-time CIO hire carries salary and benefits that are difficult to justify — and often difficult to attract — at that company’s scale.

    A fractional CIO resolves that mismatch by delivering the same strategic perspective an internal CIO would bring, with technology decisions grounded in business objectives rather than IT convention, within an engagement model sized to the company’s current stage and capacity.

    Fractional CIO vs. Part-Time IT Manager vs. Project Consultant: Where the Lines Actually Fall

    That definition clarifies what a fractional CIO is. The sharper test is what it is not, because the adjacent roles are close enough to create genuine confusion.

    Part-time IT manager is an operational role. The scope is execution: keeping systems running, managing tickets, and maintaining day-to-day vendor relationships. A fractional CIO sits above that layer entirely, setting the strategy that operational staff then execute. These roles do not compete; they occupy different altitudes. Conflating them is what produces misdirected engagements.

    Project consultant on retainer is scoped to a defined output: a system migration, a security audit, a cloud deployment. Their authority ends at the project boundary. A fractional CIO owns the decisions that precede any project, specifically what gets prioritized, what gets funded, and in what sequence. That is a categorically different type of authority.

    MSP account manager is a vendor-side role. Their objective is retention and contract expansion, not objective governance of your technology portfolio. A fractional CIO governs vendors, including the MSP itself, evaluating service delivery against business outcomes rather than contract compliance alone. One role represents the vendor’s interests; the other represents yours.

    Interim CIO is a full-time, temporary placement, typically activated during a crisis or leadership transition. A fractional CIO is a sustained, part-time engagement structured for stable strategic leadership over a defined period. The trigger conditions and organizational design are fundamentally different.

    The distinction that matters most operationally: IT governance frameworks separate strategic alignment and risk management from service delivery functions. Project-level IT advisory consulting sits in the service delivery layer; it produces recommendations but carries no ongoing accountability for outcomes. Fractional CIO services operate in the governance layer, where the person setting the strategy is accountable for the results, not just the quality of the analysis delivered.

    The organizational question is not which label fits. It is whether the company’s IT leadership gap is strategic or operational, and which model actually addresses that specific gap with the appropriate level of decision authority.

    The Decisions a Fractional CIO Actually Owns Inside Your Organization

    Once the label is settled, the operational question becomes concrete: which decisions does this person actually own?

    Technology roadmap ownership is the anchor responsibility. The fractional CIO authors a multi-year roadmap that connects IT investments directly to business growth objectives, then maintains it as a living document reviewed on a defined cycle. This is not a kickoff deliverable that gets filed after the engagement launch; it is the governing instrument the fractional CIO updates as business performance, market conditions, and technology options shift.

    Vendor governance and selection authority is where that roadmap meets real spending. The fractional CIO evaluates, selects, and governs technology vendors across the entire portfolio — MSPs, SaaS platforms, infrastructure providers, and security firms — including contract negotiation, SLA accountability, and vendor consolidation decisions. The fractional CIO’s position is objective; their job is to measure vendor performance against business outcomes, not against the vendor’s preferred metrics.

    IT budget recommendations and spend governance translate business priorities into investment decisions. The fractional CIO owns the recommendation layer, building the case for specific allocations and defending those positions directly to the CFO and CEO. This is not a summary of what IT wants; it is an executive-level argument for where technology spending produces the highest business return.

    Security and compliance posture decisions establish the organization’s risk tolerance framework. The fractional CIO owns the architecture of that framework, including decisions about security investments, compliance readiness, and incident response capability. For businesses in regulated industries across the Philadelphia region, including healthcare and financial services firms in Wilmington, Cherry Hill, and the broader metro area, this decision authority is not optional governance hygiene; it is direct risk management.

    Internal IT capability assessment examines whether the existing IT function, in-house staff or MSP-supported, can execute the strategy. Where gaps exist, the fractional CIO recommends staffing changes, capability investments, or vendor relationship restructuring.

    Board and executive reporting closes the loop. The fractional CIO translates technology performance and risk into strategic briefings that connect IT health to business exposure and growth opportunity, giving executives the context to make decisions rather than simply receive updates.

    What Falls Outside the Fractional CIO Scope (and Why That Line Matters)

    Defining what a fractional CIO owns is only half the framework. The other half is equally important: understanding what the role explicitly does not cover.

    Day-to-day IT operations fall outside fractional CIO scope. Incident tickets, help desk management, and routine maintenance belong to the operational layer, handled by an internal IT team or an MSP. That boundary is not a limitation; it is a design principle. When a fractional CIO gets pulled into operational work, their strategic capacity is consumed by execution tasks, and the executive-level perspective the company is paying for disappears into the ticket queue.

    Implementation execution is also outside scope. The fractional CIO decides what gets built or deployed and governs delivery against defined outcomes. They do not serve as project manager or hands-on technical resource for the implementation itself. Strategy ownership and execution delivery are distinct functions; conflating them collapses the governance layer.

    A fractional CIO does not replace your MSP. They govern the MSP relationship: setting performance expectations, reviewing service delivery against business outcomes, and deciding whether the current arrangement still serves the company’s strategic direction. That is a fundamentally different function than account management.

    On that same line, operational vendor management sits below fractional CIO scope. License renewals, support ticket escalations, and contract renewals belong to the IT operations layer. The fractional CIO engages at the governance level, not the account management level. There is a meaningful difference between evaluating whether a vendor relationship serves long-term business objectives and processing a renewal invoice.

    Overlapping approval authority over IT decisions can make accountability unclear and allow vendors to circumvent oversight. The same dynamic emerges when fractional CIO scope is poorly defined.

    Scope clarity is a governance design decision, not a conversation to defer. For businesses ready to move beyond reactive IT leadership, executing this across business and technology requires that the engagement structure specify these boundaries before work begins, not after role conflicts surface.

    Engagement Cadence and Deliverables: What a Fractional CIO Actually Produces

    Once scope boundaries are defined, the engagement structure needs to specify one more dimension: what the fractional CIO produces, and on what rhythm.

    Cadence is a governance design decision, not a scheduling preference. A common engagement rhythm — weekly strategy sessions, monthly executive reviews, quarterly board presentations — should be written into the engagement structure and aligned to the company’s existing planning cycles, though the right intervals depend on the organization’s planning cycles. A cadence that runs parallel to how the business makes decisions creates continuity; one that doesn’t gets treated as overhead.

    Deliverables by Engagement Stage

    The work the fractional CIO produces changes as the engagement matures.

    During the initial assessment phase, the core deliverables are a technology audit, a vendor landscape review, and a gap analysis. These establish the baseline: what exists, who provides it, and where strategic exposure lives.

    In steady-state operation, the deliverable set shifts to roadmap updates, board reports, vendor scorecards, and investment recommendations. These are not produced once and filed; they recur on the defined cadence.

    Board-Level Reporting

    Board-level technology reporting is a defining fractional CIO deliverable and one that most mid-market companies lack entirely. The fractional CIO translates infrastructure health, technology risk, and IT investment performance into a format that non-technical executives can evaluate and act on. This is not a status update; it is a strategic briefing that connects IT posture to business exposure.

    Vendor Governance as Recurring Output

    Vendor governance deliverables include formal SLA performance reviews, vendor consolidation analyses, and contract negotiation support. These are recurring outputs tied to the engagement cadence, not one-time documents produced at kickoff and forgotten.

    Defining Success Before Work Begins

    Measurable outcomes should be established at engagement outset. Useful examples include reduction in unplanned IT spend, improved vendor SLA performance, on-schedule board briefing delivery, completion of security compliance milestones, and alignment of IT budget to business priorities. Clear engagements and clear outcomes mean the accountability framework is built in from day one, not retrofitted after expectations have already diverged.

    Governance Structure: How Authority and Escalation Actually Work

    Deliverables define what a fractional CIO produces; governance defines who has the authority to act on them. Without an explicit authority structure, even the best roadmap stalls at the decision layer.

    Decision authority must be documented in three tiers. The engagement agreement should specify which decisions the fractional CIO makes unilaterally, which require CEO or CFO sign-off, and which are advisory recommendations only. Leaving this undefined forces every decision into an informal negotiation, which erodes both speed and accountability.

    Escalation paths require the same deliberate design. Consider three scenarios that arise in any technology environment: a vendor chronically misses SLA commitments, a security incident triggers a response, or a capital-intensive infrastructure investment surfaces mid-year. In each case, the fractional CIO’s role in the approval or response chain should be written down before the situation occurs, not improvised when it does. Ambiguity at the escalation layer is where strategic engagements quietly fail.

    Budget authority is a governance variable, not a default. Some engagements grant the fractional CIO direct allocation authority up to a defined dollar threshold; others are purely advisory, with spend approved through the CFO. Neither model is wrong, but organizations that leave this question open create bottlenecks where IT decisions queue behind executives who lack the context to evaluate them quickly.

    Reporting structure determines whether the function works at all. The fractional CIO must report directly to the CEO or COO. Positioning the role below the IT manager inverts the authority hierarchy and prevents the strategic function from operating above the operational layer it is supposed to lead.

    For businesses coordinating technology decisions across multiple vendors, locations, or business units, including those across Wilmington, Cherry Hill, Lancaster, and Reading, PA, governance clarity is not a formality. It is the infrastructure that makes multi-vendor, multi-site decision-making coherent rather than chaotic.

    Finally, the engagement structure itself needs a review cycle. Whether annually or at another defined interval, that review should evaluate whether the fractional CIO’s scope, cadence, and authority still match the organization’s current needs, because what fits a company at year one may be miscalibrated by year two.

    How to Determine Whether a Fractional CIO Is the Right Fit for Your Business

    Once governance structure is in place, the next practical question is whether your organization actually needs one. Five operational signals answer that more reliably than any job description.

    Strategic IT decisions are being made by default, not design. If technology investments get approved because a vendor has a strong relationship with someone in leadership, or get deferred indefinitely because no one owns the decision, the organization has a fractional CIO-shaped gap. Ownership is the operative word: decisions made by default produce technology debt, not strategy.

    IT spend is not connected to business outcomes. If your leadership team cannot answer what last year’s IT budget produced in terms of business performance, risk reduction, or competitive capability, the missing layer is strategic technology leadership. Budget accountability without outcome accountability is just expense management.

    Vendor relationships lack governance. When your MSP, SaaS vendors, and infrastructure providers are managed through invoice approval rather than performance accountability, no one is asking whether those vendors are delivering against business objectives. A fractional CIO installs that governance layer, converting passive vendor relationships into managed ones with defined expectations.

    The board or executive team cannot assess technology risk. If technology never surfaces on the board agenda in a substantive way, or if the CEO cannot speak to the company’s cyber risk posture or IT investment trajectory, that is not a reporting problem; it is a leadership gap. A fractional CIO translates technology risk into terms the executive team can evaluate and act on.

    The organization is approaching a growth event. Companies preparing for an acquisition, a capital raise, or significant operational scaling need a documented, defensible technology posture. Due diligence scrutinizes IT governance, security controls, vendor dependencies, and infrastructure scalability. A fractional CIO builds and documents that posture before it gets tested.

    When a full-time CIO hire is premature but the strategic gap is real, fractional CIO services through a firm like Orloff Phillips give mid-market businesses across Exton, Philadelphia, Wilmington, Cherry Hill, Lancaster, and Reading, PA the executive technology leadership they need, structured to match their current scale.

    Fractional CIO vs. Full-Time CIO: The Honest Trade-Off Analysis

    Once you’ve confirmed a fractional CIO-shaped gap exists, the next question is whether fractional is actually the right answer, or whether a full-time hire is what the situation demands. The honest analysis requires separating two distinct questions: scale and availability.

    A full-time CIO brings something no fractional model fully replicates. That is organizational depth: presence in every executive conversation, full operational context, and the capacity to build and manage a large IT organization over time. For businesses above a certain scale and complexity threshold, that depth matters. The fractional model does not claim otherwise.

    The case for fractional is not primarily about cost savings; it is about right-sizing. A business whose IT complexity does not yet justify a full-time CIO does not gain executive-level strategy by hiring one prematurely — it gains overhead. The strategic function is genuinely needed. The full organizational capacity is not.

    The real trade-off is availability and context depth. A fractional CIO operates on a defined cadence and will not be present for every meeting, every operational decision, or every real-time escalation. That is a genuine limitation, and it must be addressed in the engagement design through clear operating procedures that cover the gaps, not discovered after the contract is signed.

    For businesses where IT is a competitive differentiator rather than an operational support function, the full-time hire may become necessary sooner than expected. A well-structured fractional engagement accounts for this by including a transition framework so the shift, when it comes, is planned and not reactive.

    Fractional IT advisory consulting differs fundamentally from project-based advisory because it provides continuity. A project consultant starts fresh each engagement. A fractional CIO carries institutional context from quarter to quarter, accumulating the organizational knowledge that makes strategic decisions progressively sharper over time.

    The governing question is not cost. It is whether the organization’s strategic IT decisions currently have a credible owner, and which model installs that ownership most effectively at the company’s current stage.

    What the First 90 Days of a Fractional CIO Engagement Actually Look Like

    Once you’ve resolved the fractional vs. full-time question, the next practical concern is concrete: what actually happens when the engagement starts?

    The first 90 days follow a deliberate sequence, and the structure matters.

    Days 1 to 30: Discovery and Audit

    The fractional CIO’s first move is an evidence-based technology audit, not a series of introductory meetings. The scope covers current infrastructure, vendor relationships, IT spend, security posture, and internal team capability. Every finding is documented. The output is not a narrative summary of impressions; it is a gap assessment with supporting evidence that can be presented to leadership and acted upon.

    Days 30 to 60: Diagnosis and Prioritization

    Audit findings are synthesized into a prioritized gap analysis. The fractional CIO presents an initial technology roadmap identifying quick wins, near-term investments, and longer-horizon initiatives. This phase typically includes the first board or executive briefing, where technology risk and opportunity are translated into terms that non-technical leadership can evaluate and approve.

    Days 60 to 90: Governance Activation

    Vendor governance frameworks are established. MSP performance reviews are initiated against defined service expectations. The operating cadence for the engagement is formalized so that standing commitments replace ad hoc interactions — structured sessions and reporting rhythms that give the engagement continuity from this point forward.

    Orloff Phillips structures fractional CIO engagements for mid-market businesses across the Philadelphia region, including Exton, Wilmington, Cherry Hill, Lancaster, and Reading, PA, using this phased approach precisely because strategic clarity must precede execution. Changing vendors, restructuring IT spend, or deploying new infrastructure before the audit is complete produces the same problems the engagement was hired to fix.

    What separates a productive first 90 days from a passive one is willingness to surface difficult findings early: an MSP that is underperforming, IT spend with no defensible business justification, or security gaps that represent real business exposure.

    By day 90, three concrete outputs should exist: a documented technology roadmap, a functioning vendor governance structure, and an established executive reporting cadence — the evidence that a decision-owning executive is in place, not another advisor producing recommendations without accountability.

    Evaluating Fractional CIO Services: The Questions That Actually Matter

    Once the 90-day foundation is built, the real evaluation question shifts from “what did we get?” to “is this the right structure going forward?” That question deserves operational precision, not a conceptual checklist.

    What decisions does this person own outright? What requires executive sign-off? What deliverables are produced, on what cadence, and in what format? What does success look like at 12 months and 24 months, in measurable terms? Vague answers to these questions are a governance failure before the engagement even matures.

    The core distinction between a fractional CIO engagement and glorified outsourcing is accountability. Outsourcing transfers execution. A fractional CIO owns decisions and is answerable for outcomes. If no one can clearly state who made a technology investment decision or who is responsible when a vendor underperforms, the engagement is advisory in practice regardless of its title.

    Businesses across Exton, Philadelphia, Wilmington, Cherry Hill, Lancaster, and Reading, PA that are ready for that level of accountability should contact Orloff Phillips to assess whether a fractional CIO engagement fits their current gap.

    Conclusion

    A fractional CIO is not a budget compromise. It is a deliberate structural decision to place accountable executive technology leadership inside your organization without the full-time overhead that stage of growth cannot yet justify.

    The core takeaways from this guide are straightforward. First, the role is defined by decision ownership, not hours worked. Second, the engagement must have clear governance, defined deliverables, and measurable outcomes from day one. Third, the line between fractional CIO and advisory consulting is accountability; if no one owns the outcome, the title is meaningless.

    If your business is carrying technology decisions without a credible owner, that gap is costing you more than a fractional CIO engagement ever would. Businesses across Exton, Philadelphia, Wilmington, Cherry Hill, Lancaster, and Reading, PA can contact Orloff Phillips today to assess exactly where that gap exists and how to close it.

  • Declutter Your Technology Stack: Why Vendor Consolidation Matters

    Declutter Your Technology Stack: Why Vendor Consolidation Matters

    Vendor sprawl does not happen overnight. It accumulates through acquisitions, departmental purchasing decisions, and well-intentioned point solutions that quietly outlive their purpose. The result is a fragmented technology stack that consumes IT bandwidth, inflates operational costs, and creates integration debt that compounds with every new tool added to the mix.

    This analysis examines why consolidation has become a market-wide priority, with 68 percent of IT organizations planning meaningful vendor reductions by 2026. More importantly, it examines why most of those programs take far longer and cost far more than anticipated. You will learn how to distinguish strategic consolidation from simple contract cleanup, how to build a roadmap that survives contact with reality, and how to lock in the gains once the hard work is done. The organizations that execute this well do not just reduce costs; they restructure their technology foundation into a genuine competitive asset.

    How Technology Stacks Become Fragmented in the First Place

    Technology stack fragmentation is almost never a deliberate choice. It accumulates quietly, one justified purchase at a time. A sales team adopts a prospecting tool outside procurement. A merger brings three redundant platforms into the environment overnight. A department buys a point solution to fill a gap the core platform won’t address. Individually, each decision makes sense. Collectively, they produce a stack that no one fully owns.

    Every vendor added compounds the administrative load. Each relationship carries its own contract terms, renewal date, integration requirements, and support escalation path. None of this appears on a dashboard. It surfaces as calendar clutter, missed renewals, and engineering hours lost to maintaining connections that were never properly documented.

    Shadow IT accelerates the problem. When teams can provision SaaS tools with a credit card and an email address, they do, because waiting on IT governance feels slower than solving the immediate problem. The result is a growing layer of tools that central IT neither approved nor inventoried, creating data flows and access controls outside sanctioned architecture.

    The operational drag is real: duplicated functionality across departments, inconsistent data moving between systems that don’t communicate cleanly, and support tiers that vary wildly depending on which vendor owns a given workflow. Organizations that have undertaken this audit directly often find the real vendor count far exceeds internal estimates, and the savings from structured reduction are substantial.

    The longer fragmentation persists, the harder it becomes to reverse. Users build habits around specific tools. Critical data accumulates inside platforms never meant to be permanent. What started as a workaround becomes load-bearing infrastructure, and the cost of removal grows with every month it stays in place.

    Vendor Consolidation Is Now a Market-Wide Priority

    That fragmentation is not a passive problem. The market has recognized it, and the response is now coordinated at scale.

    68% of IT organizations plan active vendor reduction within the next 12 months, targeting an average 20% cut in provider count. Consolidation has moved from a forward-thinking initiative to an operational baseline. Organizations that have not yet started are behind the curve, not ahead of it.

    Three compounding pressures are driving this shift simultaneously. Economic headwinds are forcing IT budget discipline. Rising cybersecurity complexity means every additional vendor relationship expands the attack surface and the compliance burden. And executives are demanding cleaner infrastructure accountability, with fewer ownership gaps and clearer lines of responsibility when things break.

    Gartner’s framing is instructive here. Consolidation is not a cost-cutting exercise. It is architectural restructuring around a smaller set of strategic providers. That distinction matters because it changes how programs should be scoped, governed, and measured. Organizations that treat consolidation as a procurement cleanup will capture only a fraction of the available value.

    Practitioners report gains well beyond licensing savings: stronger negotiating leverage with retained vendors, reduced procurement overhead, faster support response times, and simplified compliance management across fewer audit surfaces.

    The market consensus has hardened. Organizations holding onto fragmented stacks are not preserving flexibility. They are accumulating technical and operational debt with each renewal cycle that passes without a consolidation decision.

    The Hidden Cost of Vendor Sprawl Goes Far Beyond Licensing

    Licensing fees are the most visible line in any consolidation business case, but they are rarely the largest one. The dominant cost driver is what happens after you decide to eliminate a vendor: translating data into target system formats, migrating user identities, reconstructing workflows, and preserving audit trails intact. These tasks are labor-intensive, error-prone, and almost never appear in the initial savings estimate.

    Integration overhead compounds the problem. Every additional vendor means another API connection to maintain, another data sync to monitor, and another cross-platform failure to diagnose when something breaks. That engineering time is real and recurring, yet it gets absorbed quietly into operational budgets rather than attributed to vendor sprawl directly.

    Compliance exposure scales the same way. Each provider brings its own access control model, logging format, and review cycle. Across dozens of vendors, the audit surface area multiplies, creating both regulatory risk and the administrative burden of reconciling disparate documentation during any formal review.

    Training drag is frequently underestimated. The more tools a team manages, the more onboarding hours, documentation upkeep, and context-switching accumulate, pulling productivity down across the organization without any single line item to show for it.

    Finally, vendor management itself carries substantial overhead. Contract renewals, quarterly business reviews, escalation paths, and SLA tracking across a fragmented portfolio consume real administrative capacity. Consolidation does not just reduce that burden; it directly reclaims the time and attention that fragmentation was quietly consuming.

    Understanding the Three Waves of Technology Consolidation

    Those hidden costs share a common source: fragmented stacks that were never built as a system. Understanding how consolidation actually unfolds across industries helps clarify where your organization sits and what to prioritize next.

    Consolidation has not happened all at once. It has moved in three distinct waves, each building on lessons from the last.

    Wave one, security tooling, is the most mature. By 2022, 75% of organizations had already targeted security vendor consolidation. The majority have made substantial progress since then, converging on a primary detection and response platform supported by a small number of specialized tools. The playbook that emerged, phased reduction, anchor platform selection, and sequenced decommissioning, is now a proven model.

    Wave two, SaaS productivity tools, is underway but moving more slowly. Mid-market companies have trimmed SaaS portfolios by an average of 18% over the past two years, but primarily through passive license non-renewal rather than deliberate migration. Reduction is happening; rationalization is not. That distinction matters, because passive cleanup rarely addresses the underlying governance gaps.

    Wave three, cloud platform consolidation, is next and largest. Gartner predicts that 70% of organizations will consolidate cloud-native application vendors to a maximum of three strategic providers by 2027. The architectural complexity involved makes this the highest-stakes wave yet.

    The frameworks from wave one transfer directly to waves two and three. Organizations still navigating security fragmentation face compounding risk: running all three waves simultaneously, without a sequenced approach, dramatically increases execution exposure.

    The Execution Gap: Why Most Consolidation Programs Run Over Time and Budget

    Knowing which wave to tackle next is only half the challenge. The harder problem is execution, and the data is unambiguous: most consolidation programs take 30 to 36 months to achieve an 18% reduction in vendor count, with meaningful cost savings not materializing until year three. That is 18 months longer than initial projections typically assume.

    The timeline slippage is not random. It traces directly to a single consistent underestimation: integration complexity. Decommissioning a source tool is fast. Migrating its data, reassigning user identities, and reconstructing dependent workflows inside the target system is not. Most business cases account for the former and treat the latter as a rounding error.

    Dependency mapping is the step that disappears first when programs are under-resourced. Teams skip it in favor of faster wins, then discover mid-program that the tool they planned to eliminate is quietly load-bearing for a process nobody fully documented. At that point, the elimination stalls, the timeline stretches, and confidence in the program erodes.

    Change management compounds the problem. End users resist workflow disruption. Without structured adoption programs, teams revert to familiar tools, and the consolidation partially reverses itself before savings are ever captured.

    The 18-month underestimation statistic reframes the real question. It is no longer whether to consolidate; the business case is well established. That planning discipline, not the consolidation decision itself, is where programs are won or lost.

    Consolidation vs. Rationalization: Why the Distinction Defines Your Outcome

    Those execution challenges are compounded when organizations misidentify what they are actually attempting. Most programs that stall or reverse do so because they were rationalization exercises dressed up as consolidation strategies.

    Rationalization is tactical. It terminates redundant contracts, eliminates unused licenses, and reduces vendor count as a one-time cleanup. It generates real short-term savings but leaves the underlying architecture, procurement behaviors, and governance gaps entirely intact.

    Consolidation is strategic. It restructures the technology stack around a defined set of anchor providers, renegotiates vendor relationships from a position of partnership rather than pure transaction, and treats improved interoperability as a deliberate outcome rather than a byproduct.

    The operational consequence of conflating the two is predictable: organizations that pursue rationalization alone often see re-fragmentation within a relatively short window. The departmental autonomy, shadow IT habits, and approval gaps that created sprawl in the first place remain unchanged. Without structural intervention, the stack rebuilds itself.

    Strategic consolidation also requires deliberate restructuring of MSP relationships, specifically redefining scope, accountability, and escalation paths with managed service providers rather than simply reducing how many exist. Cutting MSP headcount without redefining what each provider owns solves nothing.

    The outcomes diverge sharply. Rationalization reduces a cost line. Consolidation changes how the organization deploys, governs, and scales its technology infrastructure over time, which is a fundamentally different result.

    Building a Consolidation Roadmap That Actually Delivers

    Knowing what consolidation should achieve is only half the equation. The other half is executing it without derailing operations mid-program.

    Start with a complete technology stack audit. Catalog every active vendor relationship, contract term, integration dependency, and user base before making a single elimination decision. Incomplete inventories are the primary cause of mid-program surprises; tools that looked redundant on a spreadsheet frequently turn out to be quietly load-bearing once someone maps what actually touches them.

    This mirrors the execution-gap risk discussed earlier: dependency skips at the planning stage become the timeline overruns at the delivery stage.

    Phase the work across three horizons. Months one through six: rationalization wins, low-dependency eliminations, and contract consolidation. Months seven through eighteen: anchor platform migrations and integration reconstruction. Month nineteen onward: governance structures and controls that prevent re-fragmentation.

    Treat change management as a structured workstream, not a communications task. Consolidation programs that rely on announcements and training emails consistently underperform on timeline and savings realization. User adoption requires dedicated planning, feedback loops, and accountable ownership from the start.

    Engage external advisory support for MSP and multi-vendor restructuring. Renegotiating strategic provider terms and redefining managed service scopes requires external leverage and pattern recognition that internal IT teams rarely carry at scale. If you want to identify what’s slowing you down before committing to a program, that diagnostic step is exactly where Orloff Phillips begins with mid-market organizations.

    Locking In the Gains: Post-Consolidation Governance

    Executing the roadmap gets you to a cleaner stack. Governance is what keeps it that way.

    Without procurement controls, tool approval workflows, and vendor onboarding criteria in place after consolidation, organizations tend to re-fragment within a few years. Post-consolidation governance is the mechanism that prevents the rationalization trap described in the prior section from reasserting itself.

    A vendor governance framework closes that gap. It defines how new tools are evaluated, approved, and integrated before any purchase decision is made. Shadow IT does not disappear on its own; it needs a formal channel that is faster and less friction-heavy than working around IT entirely.

    Stack reviews should run at minimum annually. The agenda matters: assess vendor performance against contracted SLAs, flag emerging redundancies, and surface any renewals approaching in the next 90 days. Auto-renewal inertia is one of the most underestimated forces in technology management. It quietly locks in tools that no one actively chose to keep.

    Strategic vendor relationships warrant a higher level of attention than an annual review. Quarterly business reviews, defined escalation paths, and joint roadmap alignment convert transactional contracts into working partnerships. Vendors perform differently when they know accountability is structured and consistent.

    The lasting competitive advantage of consolidation is not a reduced vendor count. It is an infrastructure posture that is coherent, governable, and capable of absorbing new technology investments without generating new fragmentation. That outcome requires governance. The roadmap builds the stack; governance determines whether it holds.

    The Case for Acting Now Rather Than Later

    Governance frameworks protect gains already made. But none of those gains exist until the program starts, and the starting point determines the timeline for everything that follows.

    Those timelines are already established, what changes with delay is when savings arrive. The compounding cost of inaction is not abstract; it is quantified in deferred savings, continued integration overhead, and administrative drag that persists until the program closes.

    The audit foundation covered earlier is the non-negotiable starting point; without it, the three-wave sequence has no reliable map to follow.

    The wave sequence established earlier provides the prioritization logic; delay simply defers the governance discipline each wave builds.

    Finally, the framing an organization brings to consolidation shapes what it achieves. Programs scoped as cost-cutting exercises tend to reduce a cost line and then re-fragment. Programs scoped as strategic restructuring produce infrastructure that is faster to adapt, easier to govern, and better positioned to absorb future technology investments without rebuilding the complexity the program eliminated. The difference is not effort. It is intent.

    Conclusion

    Vendor consolidation is not a maintenance project; it is a strategic lever with measurable, compounding returns. The core lessons are clear: fragmentation carries hidden costs that dwarf licensing fees, sequencing your consolidation waves builds lasting governance discipline, a complete inventory is non-negotiable before any elimination decision, and framing matters as much as execution.

    The organizations that will lead their industries in operational agility are not waiting for a perfect window. They are starting their audits now, building their roadmaps, and treating consolidation as infrastructure for future growth rather than a one-time cost reduction.

    Your first step is straightforward: document every vendor, every contract, every dependency. From that foundation, everything else follows.

    Complexity accumulated gradually. Clarity can be built deliberately. Start the audit, commit to the strategy, and reclaim the speed your business deserves.

Orloff
Orloff AI AI
Online — Direct answers, no fluff
Powered by Orloff Phillips