Author: Orloff Phillips

  • IT Infrastructure Assessment: What a Real Audit Uncovers (and Why Most Internal IT Teams Miss It)

    IT Infrastructure Assessment: What a Real Audit Uncovers (and Why Most Internal IT Teams Miss It)

    Most businesses believe they have a clear picture of their IT infrastructure. They have monitoring dashboards, ticketing systems, and an internal team that knows the environment. What they rarely have is an honest diagnostic of what that environment is actually costing them.

    There is a significant difference between watching your infrastructure and assessing it. Monitoring tells you what is running. An IT infrastructure assessment tells you what is broken, misaligned, or quietly accumulating risk. That distinction matters more than most organizations realize, and closing the gap between the two is precisely where internal teams tend to fall short, not from lack of skill, but from lack of distance.

    This post makes the case for why structured, external infrastructure audits consistently surface findings that internal teams miss. You will learn why technical debt and vendor sprawl go undetected inside siloed organizations, what a rigorous assessment actually uncovers, how infrastructure fragmentation drives costs that rarely appear on any dashboard, and why an outside perspective produces findings that are not just different but more actionable. If your last infrastructure review felt more like an inventory than a diagnosis, this analysis is worth your attention.

    Monitoring Is Not an Assessment: Why the Confusion Is So Common

    Infrastructure monitoring and an IT infrastructure assessment are not the same function, and conflating them is one of the most expensive mistakes a mid-market business can make.

    Monitoring tracks real-time performance: uptime, latency, alert thresholds, CPU utilization. It answers the question “is the system running right now?” An IT infrastructure assessment is a structured diagnostic. It evaluates architecture, design decisions, and accumulated risk over time. It answers a fundamentally different question: “Is this environment sound, and what will it cost us if we keep running it this way?”

    The confusion persists because monitoring feels comprehensive. A dashboard with green indicators, a low ticket volume, and no recent outages creates a strong impression of a healthy environment. Internal IT teams are not wrong to use these signals; they are just wrong to treat them as a substitute for architectural review.

    This is where architectural debt becomes relevant. Infrastructure decisions made years ago, often reasonable at the time, compound in risk as the business grows. A firewall configured for a 50-person office. A backup architecture designed before the company added two acquired subsidiaries. A vendor stack assembled one contract at a time, never reviewed as a whole. None of these trigger alerts. All of them represent real exposure.

    The critical point is that this is not a competence failure. Internal IT teams are embedded in daily operations; the incentive structure rewards uptime and ticket resolution, not architectural critique.

    What Internal IT Teams Are Too Close to See

    Proximity to a system is not a neutral condition, it shapes what gets questioned and what gets normalized.

    Internal IT teams inherit the systems they support, and inheritance breeds normalization. A workaround implemented three years ago to compensate for a misconfigured integration becomes invisible over time, absorbed into “how things work here.” Decisions made under deadline pressure rarely get revisited. The institutional knowledge that makes an internal team effective day-to-day is the same force that prevents objective architectural review.

    Vendor sprawl surfaces this blind spot most clearly. Internal teams typically know which vendors are active. What they rarely assess is whether those vendors are redundant, whether contracts reflect current usage, or whether three separate agreements cover functionality one consolidated relationship could deliver more efficiently. Knowing a vendor exists is not the same as evaluating whether it should.

    Single points of failure follow a similar pattern. A critical application running on hardware past its supported life, a firewall whose configuration has not been reviewed in years, a backup process that reports nightly success but has never been tested against a full-recovery scenario: these are not mysteries. They are known risks accepted as normal because nothing has failed yet. See how this dynamic plays out across real environments in [Internal IT Rebuilt, From Bottleneck to Business Engine](Internal IT Rebuilt, From Bottleneck to Business Engine).

    Reactive work prioritization reinforces all of this, no ticket queue asks for an architectural review.

    When knowledge of how infrastructure fits together lives with one or two individuals, the organization has no mechanism for identifying what it does not know it does not know.

    What a Structured IT Infrastructure Audit Actually Uncovers

    A structured IT infrastructure audit makes those blind spots concrete, measurable, and impossible to dismiss.

    Technical debt mapping goes beyond cataloging what exists. A formal assessment documents the cost of inaction: aging hardware approaching end-of-support, software versions no longer receiving security patches, and deprecated configurations that require increasingly complex workarounds. As the Carnegie Mellon Software Engineering Institute notes, existing monitoring tools cannot detect debt that originates from design and architectural decisions, and because these issues accumulate silently, the remediation cost compounds the longer they go unaddressed.

    Vendor contract misalignment is a consistent finding. Audits regularly surface services that are over-provisioned relative to actual usage, licensing tiers that no longer match the business, and functionally duplicate contracts signed by different departments at different points in time. The cost is not hypothetical; it shows up in every renewal cycle.

    Architectural fragmentation is the structural residue of growth. Each project, acquisition, or team added tools independently. The result is an environment that technically functions but is brittle under load, expensive to support, and resistant to scaling without significant rework.

    Security and compliance exposure are areas where the gap between monitoring and assessment is most dangerous. Routine monitoring does not catch misconfigured access controls, unpatched systems outside the primary monitoring scope, or compliance drift in regulated environments like healthcare or financial services.

    Recovery and resilience gaps are consistently underestimated. A backup job reporting nightly success is not the same as a tested, validated recovery process. Audits distinguish between the two.

    Risk-to-business translation is what separates an external assessment from an internal review. Each finding is framed in operational terms: projected downtime exposure, regulatory penalty risk, and the cost of a failure that has not happened yet but is structurally inevitable.

    Why External IT Infrastructure Consulting Produces Materially Different Findings

    Those findings matter only if the process that surfaces them is structurally capable of seeing them. That is where external IT infrastructure consulting creates a categorical difference, not just a marginal one.

    Objectivity is a structural advantage, not a personality trait. An external advisor carries no institutional memory of why the legacy firewall was configured that way in 2019, no relationship with the MSP whose contract is due for renewal, and no operational dependency on the systems under review. That absence of stake is what makes honest findings possible. Internal teams are not biased because they lack skill; they are biased because the environment they are assessing is the same one they are accountable for running.

    Pattern recognition compounds across engagements. An IT infrastructure consulting firm with direct experience across organizations in the Philadelphia, Exton, and Wilmington markets sees the same vendor pitfalls, architectural antipatterns, and technical debt signatures repeat across environments. An internal team, by definition, has a sample size of one. That cross-environment exposure is what allows an external advisor to identify a risk before it has materialized, because they have seen it materialize elsewhere.

    Scope discipline produces accountable deliverables. Internal assessments stretch or compress based on team bandwidth and competing priorities. External engagements are scoped, time-bounded, and contracted to a specific output. That structure is what converts discovery into a usable result.

    The vendor relationship problem is structural: an external advisor evaluates MSP performance without institutional loyalty to protect.

    The output of a credible external assessment is not a technical inventory. It is a prioritized, business-contextualized action plan, which is what decision-makers actually need to justify investment and drive change.

    The Real Cost of Infrastructure Fragmentation Companies Consistently Underestimate

    Those external findings matter precisely because internal teams rarely see the full bill for how their infrastructure is actually structured.

    Every vendor added without a consolidation plan, every undocumented workaround left in place, every integration built on a deprecated system carries a fragmentation tax. It does not appear on a single invoice. It shows up as extra support hours, failed upgrades, integration failures that require custom fixes, and the mounting cognitive load on the two or three people who understand how the pieces actually connect.

    Technical debt behaves like financial debt: it compounds. A server migration deferred too long may eventually require a full infrastructure rebuild because the surrounding systems have since changed. Compatibility failures accelerate this. IDC research shows that 80% of IT organizations that attempt to retrofit existing tools to support new operational practices fail to deliver value, which is a direct consequence of fragmentation allowed to accumulate.

    For mid-market businesses across the Philadelphia metro, including those in Lancaster, Reading, and Cherry Hill, there is a structural cost specific to how IT services are typically arranged. The self-grading problem noted above has a direct cost: findings that would expose gaps in an MSP’s own work are the ones most likely to go unreported.

    Downtime risk compounds this further. According to New Relic research covering more than 1,700 IT and engineering executives, IT outages cost businesses a median of $33,333 per minute, with annual unplanned downtime costs reaching a median of $76 million. Without an external baseline, organizations consistently underprice business continuity exposure from undocumented single points of failure, because those failures have not yet occurred. And until a formal IT infrastructure assessment enters the planning cycle, the modernization opportunities that would reduce costs or unlock new capabilities remain invisible.

    What a Credible IT Infrastructure Assessment Actually Looks Like in Practice

    Understanding the cost of fragmentation is useful only if it leads somewhere actionable. That requires knowing what a rigorous assessment actually involves.

    Scope comes first. A credible IT infrastructure assessment opens with a business outcomes conversation, not a network scan. Before any discovery begins, the scope must be defined to cover architecture, vendor relationships, active contracts, security posture, and recovery capability. Without that alignment, the work defaults to an inventory exercise with a more expensive label.

    Discovery goes deeper than a device list. A real assessment interviews stakeholders across IT, operations, and leadership; reviews existing documentation and flags where documentation is absent; evaluates vendor contracts against actual usage; and stress-tests recovery assumptions rather than accepting a successful nightly backup job as proof of resilience.

    Findings must be organized by business risk. Technical severity rankings are useful for engineers. Decision-makers need to know what threatens operations, continuity, or compliance. A risk-tiered output lets leadership prioritize remediation based on business exposure, not ticket priority.

    Vendor and contract analysis is not optional. Any IT infrastructure assessment that skips a review of whether current MSP agreements and vendor contracts are delivering value against what is being paid is incomplete by definition. Contract misalignment is consistently one of the highest-ROI findings in a structured audit.

    The deliverable is a roadmap, not a report. What matters is a prioritized action plan with clear sequencing, effort estimates, and business justification. That is what an internal team can execute against, and what forms a durable foundation for ongoing IT infrastructure management.

    Why Regional Businesses in Philadelphia and Surrounding Areas Face This Problem Acutely

    The actionable value of any infrastructure assessment depends heavily on whether its findings can be acted on within your actual business environment. That is where geography and market context matter more than most engagements acknowledge.

    Mid-market businesses across Exton, Philadelphia, Wilmington, Cherry Hill, Lancaster, and Reading, PA occupy a structural gap that makes this problem particularly acute. They are too large for a single generalist IT resource to cover architecture, vendor management, and daily operations simultaneously. They are too small to staff a dedicated infrastructure team with the specialization those functions genuinely require. The result is a permanent triage mode where reactive work crowds out diagnostic work.

    That gap is typically filled by an MSP. The problem is that most of these businesses have no independent oversight of that relationship. The vendor managing the infrastructure is also the one evaluating it, a conflict that produces consistently incomplete findings. External advisory exists precisely to break that loop.

    Regional growth patterns compound the issue. Businesses in southeastern Pennsylvania that scaled through acquisition, rapid hiring, or accelerated digital transformation are particularly likely to be carrying architectural debt their internal teams haven’t had bandwidth to surface or address.

    The regulatory stakes are also significant. Healthcare, financial services, professional services, and manufacturing are prominent industries across the Delaware Valley. In those industries, undetected infrastructure gaps aren’t just operational risks; they can constitute compliance exposures under frameworks such as HIPAA, GLBA, and SOC 2, depending on the industry.

    An advisor with direct experience in this regional ecosystem, its MSP landscape, its dominant industries, and its vendor market, produces findings that translate into decisions you can actually execute locally.

    The Case for Getting an Outside View on Your Infrastructure

    The businesses that most need an honest infrastructure assessment are the ones least likely to get one from the teams already managing their environment.

    An IT infrastructure assessment is a diagnostic, not an inventory. Delegating it entirely to the internal team that built and runs the infrastructure guarantees that the most consequential findings, the ones rooted in decisions made years ago and normalized through daily operations, will never reach the surface. Three risk categories are the most consequential findings in external audits: architectural debt accumulated through growth, vendor and contract misalignment, and undocumented single points of failure.

    For mid-market businesses across the Philadelphia region, the path forward is straightforward. That structural independence is what produces a prioritized, honest picture of infrastructure risk and a credible roadmap to modernize IT infrastructure where it matters most.

    Orloff Phillips conducts structured IT infrastructure assessments for businesses across Exton, Philadelphia, Wilmington, Cherry Hill, Lancaster, and Reading, PA, delivering findings that internal teams and incumbent MSPs are not positioned to produce.

    The right starting point is a scoping conversation, not a full commitment. Let’s start a conversation about what an assessment should cover for your specific environment before you proceed.

    Conclusion

    The gap between monitoring and assessment is not a minor distinction; it is where significant infrastructure risk lives undetected. Internal teams, despite their competence, are too embedded in daily operations to see architectural debt, contract misalignment, and undocumented failure points with clear eyes. A structured external audit changes that equation entirely.


  • When Your MSP Is Costing You More Than It’s Saving: How to Spot the Breaking Point

    When Your MSP Is Costing You More Than It’s Saving: How to Spot the Breaking Point

    You hired your managed service provider to reduce complexity, contain costs, and keep your business running. But somewhere between the contract signing and today, the relationship quietly inverted. Now you are the one absorbing the inefficiencies, explaining the gaps, and writing checks for outcomes you cannot fully measure.

    The uncomfortable truth is that businesses routinely delay acting on a failing MSP relationship far longer than the cost warrants. Not because the warning signs are absent, but because they lack the diagnostic framework to distinguish normal friction from structural failure. That tolerance has a price, and it rarely appears as a single line item on your P&L.

    This analysis gives you the tools to stop guessing. You will learn how to quantify the real cost of inaction, identify the red flags that signal systemic failure, benchmark your current provider against what high-performing MSPs actually deliver, and use a concrete decision rubric to determine whether your situation calls for a fix or an exit. Most importantly, you will understand what a professional cleanup engagement looks like and why waiting another quarter will only make it more expensive.

    The Real Cost of Waiting 12 to 18 Months

    Most businesses in the Philadelphia, Exton, and Wilmington region see the warning signs clearly. Tickets that reopen. Escalations that go nowhere. Infrastructure decisions that never quite happen. What they lack is not awareness; it is a framework precise enough to act on.

    That gap is expensive. Every month without a diagnostic, the cost structure quietly worsens. Unresolved service gaps deposit technical debt into your environment. Frustrated departments route around unreliable infrastructure by adopting their own tools, fragmenting your security posture and multiplying your vendor footprint without any corresponding oversight. None of this appears as a line item. All of it compounds.

    The operational damage is often harder to price than the direct financial loss, and more durable. Staff productivity erodes when technology is consistently unreliable. Internal IT loses organizational credibility. Executives begin making strategic technology decisions without involving IT governance, because IT governance has stopped delivering confidence. Once that trust decays, rebuilding it costs significantly more than the original intervention would have.

    The inaction window is not a vendor failure. It is a diagnostic failure. Businesses delay because complex vendor relationships produce friction by nature, and distinguishing that normal friction from chronic dysfunction requires calibration tools most organizations do not have internally. Without those tools, every quarter of inaction feels defensible rather than costly.

    This piece provides that calibration. The sections that follow examine the structural reasons MSP relationships deteriorate, the specific red flags that separate systemic failure from recoverable underperformance, the financial benchmarks that convert suspicion into evidence, and a concrete fix-vs-exit decision rubric. For businesses that have already passed the threshold, there is a clear picture of what a professional MSP relationship cleanup engagement actually delivers.

    If you want to understand how this kind of structured work unfolds in practice, a live conversation on real execution is a direct place to start.

    The cost of the next quarter’s delay is the same as the last one’s. The difference is that now you have a framework to see it accurately.

    Why So Many MSP Relationships Are Structurally Broken

    That diagnostic problem has a financial root that most buyers never see.

    Industry data makes the structural reality difficult to ignore: 28% of managed service providers are not profitable, and the average MSP profit margin sits at roughly 8%. Best-in-class operators, by contrast, achieve 19%+ adjusted EBITDA. That gap does not reflect a competitive market sorting winners from losers on service quality. It reflects a large segment of the industry operating with broken internal economics.

    The profitability shortfall traces back to how many MSPs account for their own costs. A significant number exclude technician and support staff salaries from service-line cost of goods sold. That accounting choice makes individual service lines appear more profitable than they are, which in turn distorts pricing decisions, resource allocation, and staffing levels. The MSP’s financial reports look acceptable. The actual economics of what they are delivering to each client do not.

    This matters because those distortions have direct operational consequences downstream. When an MSP underprices a service line based on inflated margin assumptions, they chronically under-resource it. When they misallocate staff costs, they cannot identify which clients or services are consuming margin and which are generating it. The result is a provider making reactive decisions about your account based on financial data that does not accurately represent their cost to serve you.

    The 2026 trend line sharpens this concern. Managed service provider trends show margin compression intensifying even as industry revenue grows. An MSP can post top-line growth while quietly cutting corners on tooling, proactive monitoring, and senior technician coverage. From the outside, the business looks viable. From inside your support queue, capacity quietly erodes.

    One pattern that surfaces consistently in structured diagnostics is that service-delivery failures are rarely about attitude or effort. They are byproducts of an MSP managing its own financial survival at the expense of client outcomes.

    Understanding this reframes how you should respond. Poor response times and recurring incidents are symptoms. The structural misalignment underneath them is the actual problem to diagnose.

    Red Flags That Signal Systemic Failure, Not Normal Friction

    That structural dysfunction described above doesn’t stay contained inside your MSP’s financials. It surfaces in your operations, often in patterns that feel like recurring bad luck rather than systemic failure. The difference between normal friction and structural breakdown is diagnosable once you know what to look for.

    Recurring incidents without root cause resolution are the clearest signal. A well-functioning managed service provider closes a ticket and prevents the same class of problem from reappearing. Systemic failure looks different: the same categories of issues show up in monthly reports quarter after quarter, with patches applied but no structural fix ever documented. If your endpoint outages, connectivity failures, or security alerts follow a repeating pattern, that repetition is data.

    Pricing that hasn’t been reviewed in over 12 months is a warning sign that affects you directly. Service delivery margins should fall between 40% and 70%; providers operating below that threshold cut costs somewhere, and that somewhere is usually staffing, tooling, or proactive work on your account. An MSP that hasn’t raised rates isn’t doing you a favor; it’s quietly degrading the resources allocated to your environment.

    Inability to produce clear service-line reporting is a diagnostic finding in itself. If your provider cannot break down performance and cost by service type, covering endpoints, security, cloud infrastructure, and helpdesk separately, they are not managing their own economics with enough precision to manage yours. Opacity at the reporting level almost always reflects operational confusion underneath it.

    Technician turnover is a direct service risk, not an HR abstraction. Employee replacement costs run 80% to 120% of annual salary, and every departure takes institutional knowledge of your specific environment with it. For businesses in Exton, Philadelphia, and the surrounding region, this churn creates compounding exposure: new technicians misread your configurations, re-escalate issues that were already resolved, and restart a learning curve you already paid for once.

    MRR dependency below the 75% industry benchmark signals misaligned incentives. An MSP deriving the majority of its revenue from break-fix and project work benefits financially when your systems fail. Proactive prevention shrinks their billable hours. That is a structural conflict of interest, not a coincidence.

    Escalation patterns that consistently reach leadership indicate process failure, not personnel failure. When tickets bypass the technician tier and land on vendor or client executives to resolve, it means the internal escalation process has broken down. One escalation is an incident; a recurring pattern is evidence that the provider lacks the process maturity to resolve problems at the level where they originate.

    Any single flag here might be explainable. Three or more appearing together, especially over multiple quarters, crosses the threshold from friction into systemic failure.

    The Benchmarks That Turn Suspicion Into Evidence

    Recognizing red flags is the first step; quantifying them is what converts a gut feeling into a defensible business case. These four benchmarks give you concrete calibration points to apply to your current provider.

    EBITDA margin reveals reinvestment capacity. That same 8%-vs-19% EBITDA spread documented earlier translates directly into reinvestment capacity: a provider at the lower bound is structurally unable to fund tooling upgrades, staff training, or proactive monitoring improvements. Nearly one in three MSPs operates at break-even or a loss, which means a meaningful portion of the market cannot fund the service quality their contracts promise.

    Service delivery gross margin reveals pricing and cost discipline. The target range for service gross margin is 50 to 60%, within a broader acceptable band of 40 to 70%. Providers operating below this threshold are either pricing their services below sustainable levels or mismanaging labor and overhead allocation. Both conditions produce the same downstream result: your account absorbs the operational consequences of their financial mismanagement.

    Client churn rate reveals whether your frustration is unique. The industry benchmark for healthy annual client churn is below 5%. Persistent turnover above that rate signals systemic client dissatisfaction, not isolated account issues. If your provider is losing clients at an elevated rate, the problems you are experiencing are likely shared across their book of business, and your account is not receiving priority remediation.

    Recurring revenue mix reveals incentive alignment. An MSP whose monthly recurring revenue represents at least 75% of total revenue is structurally motivated to keep your systems running reliably. Providers below that threshold depend on break-fix and project work to fill the revenue gap; their financial model rewards failure rather than prevention.

    Reporting structure reveals operational maturity. Managed service provider examples of best-in-class operators share one consistent practice: they track and report separately across four categories, Product Sales, Technical Services, Managed Services, and Professional Services. That granularity is not administrative overhead; it is evidence that a provider understands their own economics precisely enough to manage yours.

    If your MSP cannot produce segmented reporting across these categories when asked, that is not a minor documentation gap. The inability to provide basic financial and operational transparency is itself a diagnostic finding, one that belongs in your decision framework alongside every other metric above.

    The Fix-vs-Exit Decision Rubric

    Once the benchmarks have surfaced hard evidence, the next question is binary: repair or replace. The answer depends on where the dysfunction actually lives.

    Signs the Relationship Is Worth Repairing

    A recoverable MSP relationship has three consistent characteristics. First, the underperformance is concentrated, not distributed. If service failures cluster around a specific function, such as helpdesk response times or backup verification, that is a process gap, not an organizational failure. Second, leadership acknowledges the shortfall and engages without deflection. Third, the contract contains scope renegotiation provisions. Without that flexibility, even a willing provider cannot structurally adjust to closing gaps.

    Financial stability and adequate staffing are preconditions, not bonuses. An MSP that can demonstrate both is one that has the capacity to invest in fixing what is broken on your account.

    Signs the Relationship Has Crossed a Structural Threshold

    The exit indicators are more decisive. If your MSP cannot produce basic service-line or financial reporting, that is not a reporting lag; it reflects an internal management failure that flows directly into your environment. Visibly high technician turnover is a compounding signal: each departure carries institutional knowledge of your infrastructure, a cost already quantified in the red flags section.

    Two additional signals close the case. If the provider has not proactively addressed pricing or scope despite documented margin pressure, they are managing their survival quietly. And if escalation attempts across multiple quarters have produced no systemic change, the organizational capacity for improvement is absent, not just delayed.

    The Fragile-but-Present Middle Category

    The most dangerous MSP relationships are not the obviously broken ones. Financially fragile providers that remain operationally present are often the last to acknowledge their condition. Because 28 percent of MSPs are currently unprofitable, this category is larger than most buyers assume. These providers will not invest in tooling, training, or staffing improvements while managing their own cost pressure. Client outcomes absorb those cuts first, often invisibly.

    Factoring in Transition Risk

    Exit decisions require an honest transition assessment. How deeply is this provider embedded in your infrastructure? Does documented runbook-level knowledge of your environment exist, or does critical configuration knowledge live only with a technician who may have already left? For a mid-sized business in Lancaster, Cherry Hill, or Reading, PA, a responsible MSP transition requires a timeline that depends entirely on the quality of existing documentation, adequate runbooks compress the window; absent ones extend it significantly.

    Why External Perspective Matters Here

    Applying this rubric internally is difficult. Stakeholders with long-standing vendor relationships tend to weight relational history over operational evidence, which is why high-stakes vendor decisions in legal, finance, and operations routinely involve outside advisors. An MSP relationship cleanup is no different.

    Hidden Costs Your P&L Is Not Capturing

    The fix-vs-exit rubric tells you what to decide. What it cannot show you is the full financial weight of the decision you’ve been deferring, because the most damaging costs of MSP underperformance never appear on your monthly invoice.

    Technical debt is the first invisible liability. Deferred maintenance, inconsistent patching, and undocumented configurations do not generate a line item. They accumulate silently, and they compound. Every month without proper hygiene raises the remediation cost and extends the timeline of any future infrastructure improvement or provider transition. By the time a structured diagnostic surfaces the full scope, the debt is often measured in weeks of recovery work, not hours.

    Shadow IT follows from lost confidence. Shadow IT sprawl, already introduced above, also fragments your compliance posture and adds undisclosed cost to your technology footprint.

    Vendor sprawl is the operational footprint of that same dysfunction. An underperforming MSP rarely rationalizes your technology stack proactively. The result is redundant tools, overlapping contracts, and renewal cycles that drift past without active management. You pay for capabilities you already have, and no one is accountable for the overlap.

    The internal reputational cost is real and measurable, even if it’s harder to quantify. The organizational credibility erosion described earlier compounds here: reduced IT trust leads executives to bypass governance, which further depresses the case for future investment.

    Staffing and knowledge continuity compound every other cost on this list. Technician turnover, already quantified at 80–120% of annual salary per departure, also transfers invisible onboarding friction and misconfiguration risk to your environment.

    For businesses in Exton, Philadelphia, Wilmington, and the surrounding regional markets, these costs routinely exceed the contract fees they’re paying on paper. None of them surface in a standard financial review. They only become visible when a structured diagnostic is applied systematically, which is precisely what makes the decision to engage one so high-return relative to its cost.

    What a Professional MSP Relationship Cleanup Actually Looks Like

    Applying a structured diagnostic to those hidden costs is only useful if it leads somewhere actionable. That is where a professional cleanup engagement differs fundamentally from a vendor audit.

    An audit produces findings. A cleanup engagement produces outcomes, moving through three phases with defined deliverables at each stage.

    Phase 1: Diagnostic

    The diagnostic establishes a factual baseline across five dimensions: financial transparency, service delivery performance, contract alignment, documentation quality, and infrastructure hygiene. Each dimension produces a clear verdict, functioning or structurally failed. The output is not a scorecard to share with your MSP. It is a decision-grade picture of what is recoverable and what is not, built before any conversation about remediation begins.

    Phase 2: Intervention

    Intervention targets the highest-priority gaps the diagnostic identifies. That typically means renegotiating service scope and pricing terms that no longer reflect actual delivery, resolving documentation deficiencies that have created knowledge dependencies, consolidating vendor sprawl that accumulated without oversight, and establishing accountability mechanisms the MSP must meet on a defined timeline. These are not suggestions forwarded to your provider. They are structured requirements with measurable compliance checkpoints.

    Phase 3: Stabilization

    Stabilization confirms that changes have held. Performance benchmarks are verified consistently over time, not spot-checked once. Critically, this phase assesses whether your internal governance over the MSP relationship is strong enough to sustain the improvement independently. The engagement ends when the client no longer needs advisory support to hold the provider accountable.

    When Exit Is the Right Call

    For businesses where the relationship cannot be repaired, the cleanup engagement shifts in scope. Transition risk is assessed formally, documentation is remediated to reduce dependency on the incumbent provider’s institutional knowledge, and vendor selection support is provided to avoid replicating the same structural failures with a new provider.

    Orloff Phillips structures these engagements for businesses in Philadelphia, Exton, Wilmington, Lancaster, and Cherry Hill, where regional MSP relationships frequently reflect the financial fragility and operational gaps described throughout this analysis. If your situation matches more than a few of the patterns covered here, starting a conversation about a structured diagnostic is the lowest-cost next step available.

    Managed Service Provider Trends Making This Decision More Urgent in 2026

    The cleanup framework described above is time-sensitive in ways that go beyond your individual vendor relationship. Several converging managed service provider trends make 2026 a particularly consequential year to act.

    The pricing pressure cycle is already active. MSP pricing reviews are cyclical, and providers facing margin compression must eventually choose between raising rates and cutting service investment. The 8%-vs-19% EBITDA gap already established means providers below that threshold face one choice: raise rates or cut service investment, both of which affect your operations.

    Margin deterioration is not always visible from the outside. An MSP that appears stable by revenue may be cutting corners on staffing, tooling, or proactive maintenance to preserve the margins they are not capturing through appropriate pricing. That 28% unprofitable share includes providers who appear viable until a capacity event exposes the fragility.

    Service-line profitability is now a dividing line. The ability to answer basic questions about which service lines are profitable, and which are subsidized by others, is becoming the defining operational differentiator between strong and weak providers in 2026. Providers who cannot produce that analysis internally are not equipped to manage the economics of your environment with any precision either.

    The window for a managed transition is narrowing. Financially fragile MSPs that have not addressed their margin problems by mid-2026 face real capacity risk that can affect clients without advance warning. Acting now, before a forced transition, preserves your options and your timeline.

    Data is not the gap; interpretation is. Vendor-agnostic performance metrics and KPI tracking tools are already standard in the industry. What most businesses lack is the diagnostic framework to translate that data into a clear decision, which is precisely where external advisory expertise delivers its most immediate value.

    Stop Absorbing the Cost of Inaction

    The delay pattern is not a failure of leadership judgment. It is a predictable outcome of lacking the diagnostic vocabulary to separate fixable dysfunction from structural failure. Without that vocabulary, every quarter of inaction feels defensible, and every quarter of delay compounds the hidden costs documented above.

    That diagnostic gap is now closed. The benchmarks documented above, EBITDA spread, service margin threshold, and churn standard, are calibration tools you can apply today. The fix-versus-exit rubric is defined. The cleanup engagement model is structured, sequenced, and scoped. The only remaining variable is whether your organization acts before the hidden costs compound further into a forced transition.

    For businesses in Philadelphia, Exton, Wilmington, Lancaster, Cherry Hill, and Reading, Orloff Phillips provides exactly this structured diagnostic and cleanup framework. The goal is not to add another vendor to your stack. It is to turn a frustrating, costly, and unresolved vendor situation into a closed operational problem with measurable outcomes.

    The starting point is straightforward. Take the red flags and benchmarks outlined in this piece and apply them to your current relationship honestly. If two or three match your experience, the relationship warrants serious diagnostic attention. If four or more match, the cost of waiting another quarter is almost certainly higher than the cost of acting now.

    Let us help identify what’s slowing your business down before another quarter of avoidable cost makes the decision for you.

    Conclusion

    The decision now belongs to you. Apply the diagnostic criteria honestly, count the red flags against your current relationship, and let the numbers guide the conversation rather than your frustration.

    If your organization is ready to close this operational gap with structure and clarity, Orloff Phillips is ready to help. The cost of another delayed quarter is documented. The path forward is clear. Take the first step today.

  • Cybersecurity Trends in 2026: What Enterprises Must Know

    Cybersecurity Trends in 2026: What Enterprises Must Know

    The defining cybersecurity story of 2026 is not a single threat. It is the convergence of autonomous AI, identity fragmentation, quantum urgency, and regulatory deadlines arriving at the same time. Enterprises that treat these as separate problems will spend the year reacting. Those that see the pattern will get ahead of it.

    Here is what the threat picture actually looks like right now:

    • Autonomous AI agents are embedding across enterprise applications at a pace most security teams did not anticipate, creating credential and isolation gaps that attackers are already exploiting.
    • Identity-first security has moved from a framework preference to a national security priority, driven by the reality that AI agents rarely operate with scoped permissions.
    • Zero Trust architectures, combined with continuous exposure management, are producing measurably better breach outcomes for early adopters compared to peers still running perimeter-based models.
    • Quantum-safe cryptography is no longer a future-state conversation. Government mandates and NIST post-quantum standards are forcing enterprises to act now, not in three years.
    • Regulatory deadlines are compressing. The CIRCIA final rule requiring 72-hour breach reporting for critical infrastructure entities is expected in September 2026, and California’s cybersecurity risk assessment rules for automated decision-making are already in effect.
    • IBM Security Services and X-Force Threat Intelligence data confirm that AI-driven attacks are accelerating intellectual property risk and expanding attack surfaces faster than most enterprise defenses can track.

    The sections below break down each of these trends with the specificity you need to brief your board, update your security roadmap, or pressure-test your current posture.

    1. How are autonomous AI agents changing enterprise security?

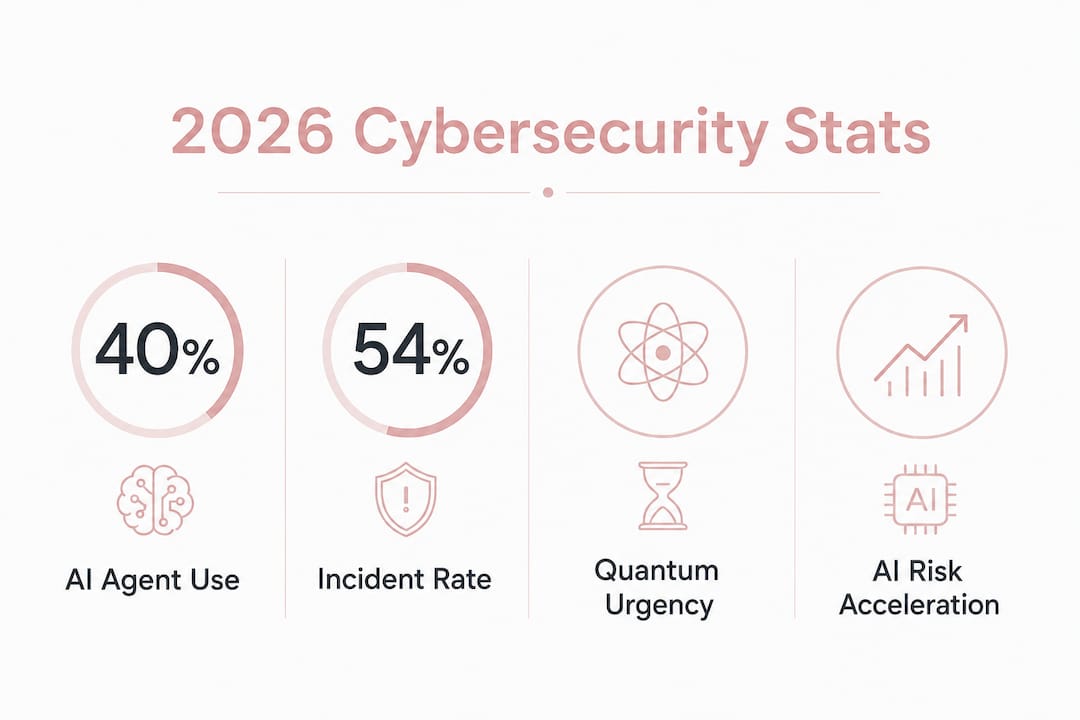
    Infographic highlighting key cybersecurity statistics for 2026

    AI agent adoption is expected to grow from less than 5% of enterprise applications in 2025 to 40% by the end of 2026. That growth curve is the core problem. Security programs built for human users and static software simply do not map onto agents that act autonomously, call external APIs, and persist across sessions.

    Hands typing on keyboard in tech home office

    The data on what is already going wrong is stark. 54% of enterprises have experienced an AI agent security incident or near miss. Yet 69% still allow agents to share credentials, and only 30% isolate high-risk agents in sandboxed environments. That gap between deployment speed and security controls is where most of the current exposure lives.

    Cybersecurity team reviewing incident reports in meeting room

    MetricCurrent State
    Enterprise apps using AI agents (2025)Less than 5%
    Enterprise apps using AI agents (end of 2026, projected)40%
    Enterprises with AI agent incidents or near misses54%
    Enterprises allowing credential sharing among agents69%
    Enterprises isolating high-risk agents30%
    Enterprises planning agent security tooling upgrades in 202659%

    Best practices emerging from security leaders include assigning unique machine identities to each agent, enforcing least-privilege access at the agent level, logging all agent actions for forensic traceability, and treating agent-to-agent communication as an untrusted channel by default. The NIST Cybersecurity Framework provides a governance baseline, but most organizations need agent-specific extensions on top of it.

    Pro Tip: Before deploying any new AI agent in a production environment, map every credential it touches and every external system it calls. If you cannot draw that map in under 30 minutes, the agent is not ready for production.

    2. Why identity security has become a national security priority

    Identity is the new perimeter, and the AI agent explosion has made that phrase literal rather than metaphorical. When an agent shares a human service account credential, a single compromise does not just expose one user. It exposes every system that credential touches, often across multiple business units, with no clean audit trail showing which actions were human and which were automated.

    The consequences of inadequate identity governance in an AI-heavy environment include:

    • Expanded blast radius: Shared credentials mean a compromised agent can move laterally across the entire scope of that credential’s permissions.
    • Forensic opacity: Distinguishing malicious agent activity from legitimate automation becomes extremely difficult after the fact.
    • Compliance exposure: Regulations like HIPAA, enforced by the HHS Office for Civil Rights, and financial sector rules from the FFIEC require demonstrable access controls that shared agent credentials cannot satisfy.

    Emerging identity standards for 2026 center on scoped machine identities, short-lived tokens, and continuous authentication rather than static API keys. The federal government’s push on identity, reflected in CISA guidance and the Department of Defense’s CMMC framework, signals that identity governance is no longer a vendor conversation. It is a policy one. For enterprise security leaders, the practical implication is straightforward: every AI agent needs its own identity, and that identity needs to be auditable.

    3. How do Zero Trust and continuous exposure management work together?

    Zero Trust operates on one principle: never assume a connection is safe because of where it originates. Every user, device, and workload must authenticate and be authorized continuously, not just at login. Enterprises that adopted Zero Trust frameworks before 2024 are seeing substantially better security outcomes and faster breach containment times compared to peers still running implicit-trust network models.

    Continuous Exposure Management (CEM) is the operational layer that makes Zero Trust sustainable at scale. Rather than running point-in-time vulnerability scans, CEM provides ongoing visibility into the attack surface, prioritizing exposures by actual exploitability rather than theoretical severity scores. Together, Zero Trust and CEM shift security from a reactive posture to a persistent one.

    Managed Detection and Response (MDR) solutions fit naturally into this architecture. MDR providers combine 24/7 threat monitoring, AI-assisted triage, and human analyst escalation to close the gap between detection and response. For mid-sized enterprises without a full security operations center, MDR is often the most practical path to Zero Trust-aligned detection coverage. The cybersecurity strategy considerations for organizations at this stage typically center on which MDR capabilities to build internally versus source externally.

    Advanced threat detection techniques layered into this ecosystem include:

    • Behavioral analytics to flag anomalous agent or user activity against established baselines.
    • Deception technology such as honeytokens and honeypots that trigger alerts when accessed.
    • AI-assisted log correlation across cloud, endpoint, and network telemetry to surface attack chains that rule-based systems miss.

    4. Quantum-safe cryptography: why 2026 is the year to act

    Traditional public-key encryption, including RSA and elliptic-curve cryptography, relies on mathematical problems that quantum computers will eventually solve in hours rather than years. “Harvest now, decrypt later” attacks are already happening: adversaries collect encrypted data today with the intent to decrypt it once quantum capability matures. Any data with a long confidentiality shelf life, including health records, financial contracts, and intellectual property, is already at risk.

    NIST finalized its first post-quantum cryptographic standards in 2024, including CRYSTALS-Kyber for key encapsulation and CRYSTALS-Dilithium for digital signatures. These are the building blocks enterprises need to start testing now. Government agencies operating under NSA’s Commercial National Security Algorithm Suite 2.0 (CNSA 2.0) have mandatory migration timelines that are already running.

    Cryptographic agility is the strategic response: designing systems so that cryptographic algorithms can be swapped without rebuilding the underlying architecture. Enterprises that hardcode a single algorithm into their infrastructure will face expensive rework when migration deadlines arrive. The practical steps for 2026 include:

    • Inventory all cryptographic dependencies across applications, APIs, and data stores.
    • Prioritize high-value data for early migration to post-quantum algorithms.
    • Test NIST-approved algorithms in non-production environments before committing to production rollouts.
    • Update vendor contracts to require post-quantum readiness roadmaps from all technology suppliers.

    5. Deepfakes, synthetic identities, and the new ransomware playbook

    The threat landscape in 2026 has a distinctly generative quality. Deepfake audio and video are now cheap enough to use in targeted business email compromise attacks, with attackers impersonating CFOs or legal counsel to authorize wire transfers or data disclosures. Synthetic identity fraud, where AI assembles plausible fake identities from real data fragments, is accelerating in financial services and healthcare onboarding.

    Ransomware has evolved past simple encryption. The dominant model now combines data exfiltration with encryption, giving attackers two leverage points: pay to restore access, or pay to prevent publication of stolen data. Some groups have added a third: threatening to notify regulators about the breach, using the victim’s own compliance obligations as coercion. Resilience strategies enterprises are prioritizing include:

    • Tabletop exercises that simulate ransomware scenarios including the regulatory notification clock.
    • Immutable backup architectures that attackers cannot reach through compromised admin credentials.
    • Cyber insurance reviews to confirm that policies cover extortion payments and regulatory fines, not just recovery costs.
    • AI-assisted phishing detection trained on deepfake indicators, not just text-based signals.

    The workforce dimension matters here too. Security teams that have never responded to a deepfake-enabled social engineering attack need practice before the real event. Simulation platforms that generate synthetic deepfake scenarios for training are moving from experimental to standard practice.

    6. What does the 2026 regulatory environment actually require?

    Two regulatory developments are reshaping enterprise compliance programs right now. First, the Cyber Incident Reporting for Critical Infrastructure Act (CIRCIA) final rule is expected in September 2026, requiring covered entities to report confirmed breaches to CISA within 72 hours of reasonably believing a covered incident occurred. That window is tight. Organizations that lack automated detection and a pre-approved incident response playbook will struggle to meet it.

    Second, California’s privacy protection agency finalized cybersecurity risk assessment rules applying to companies that process significant personal data or exceed defined revenue thresholds. These rules require documented risk assessments, not just policies.

    The broader governance picture includes:

    • NIST CSF 2.0, which added a “Govern” function to the original five, making board-level accountability explicit.
    • Secure-by-design principles from CISA, which shift responsibility for security defaults from end users to technology manufacturers.
    • DevSecOps practices that embed security testing into CI/CD pipelines rather than treating it as a pre-launch gate.

    For enterprises, regulatory convergence means that a single incident can now trigger obligations under CIRCIA, state privacy laws, HIPAA, and sector-specific rules simultaneously. Compliance teams that manage these in separate silos will miss cross-cutting obligations.

    7. How AI regulations are reshaping cybersecurity audits

    California’s final rules on automated decision-making require companies to conduct cybersecurity risk assessments specifically for AI systems that make or inform consequential decisions about individuals. This is a meaningful shift: it treats AI models as security assets requiring the same audit rigor as databases or network infrastructure.

    Regulatory note: California’s cybersecurity risk assessment requirements for automated decision-making technologies took effect in 2026, applying to companies processing significant personal data or meeting defined revenue thresholds. Covered organizations must document AI-specific risks, not just general data security controls.

    The practical audit implications include mapping which AI models touch personal data, documenting the data flows into and out of those models, and assessing the security controls around model training pipelines. AI governance frameworks from sources like the Stanford HAI AI Index show that most enterprises are still treating AI risk as a separate track from cybersecurity risk. Regulators are closing that gap whether organizations are ready or not.

    For security leaders, the integration point is the enterprise risk register. AI systems need entries alongside traditional IT assets, with owners, control assessments, and remediation timelines. Compliance teams working through the intersection of data privacy and AI governance will find that the documentation requirements overlap significantly with existing privacy program obligations.

    8. How AI is accelerating intellectual property risk

    IBM Security Services and X-Force Threat Intelligence flag AI-driven IP risk as one of the most underappreciated attack vectors of 2026. The mechanism is not complicated: AI tools trained on or given access to proprietary data can leak that data through model outputs, API responses, or prompt injection attacks. An employee who pastes a confidential contract into a public large language model has effectively exfiltrated that data, even if no malicious actor was involved.

    The attack surface expands further when enterprises deploy AI agents with access to internal knowledge bases, code repositories, or customer records. An agent compromised through a prompt injection attack can be directed to exfiltrate data in ways that look like normal agent behavior. Traditional data loss prevention tools, built for human-initiated file transfers, often miss this pattern entirely.

    Practical controls for IP protection in an AI-heavy environment include data classification policies that explicitly cover AI inputs and outputs, contractual restrictions on vendor AI training using customer data, and monitoring for unusual query patterns against internal knowledge bases. The AI governance guidance available for enterprise teams increasingly addresses these specific vectors rather than treating AI risk as purely a model accuracy problem.

    9. The cybersecurity talent shortage is getting worse, not better

    The gap between open cybersecurity positions and qualified candidates has not closed. It has widened, partly because the skill requirements have shifted. Organizations now need people who understand AI security, cloud-native architectures, and OT/IT convergence simultaneously. That combination is rare, and the pipeline from universities and bootcamps has not caught up.

    Workforce development strategies that are gaining traction in 2026 include:

    • Upskilling existing IT staff in security fundamentals rather than waiting for specialist hires.
    • Security automation to reduce the manual workload on analysts, letting smaller teams cover more ground.
    • Managed security service providers to fill coverage gaps, particularly for overnight and weekend monitoring.
    • Apprenticeship programs partnered with community colleges, which are producing job-ready candidates faster than four-year degree programs for many technical roles.

    The talent shortage also has a retention dimension. Security professionals experiencing alert fatigue from understaffed SOCs are leaving for less demanding roles. Organizations that invest in automation to reduce noise and give analysts more meaningful work tend to retain staff longer. That is not a soft benefit. Turnover in a security team during an active incident is a material risk.

    10. How geopolitical tensions are reshaping cybersecurity policy

    State-sponsored cyber activity from Russia, China, North Korea, and Iran has moved from occasional headline events to persistent background noise for enterprise security teams. The targets have broadened beyond defense contractors and government agencies to include supply chains, financial infrastructure, and critical utilities. NERC’s CIP-003-11 standard, effective may 26, 2026, directly addresses coordinated cyberattacks on distributed low-impact bulk electric system assets, reflecting how seriously regulators now take the infrastructure threat.

    The policy response in the United States has accelerated on several fronts. Export controls on advanced semiconductors limit adversary access to the compute needed for AI-enabled offensive operations. Software supply chain security requirements, including SBOM mandates for federal contractors, are spreading into commercial sectors. Enterprises with international operations face the additional complexity of conflicting data localization requirements across jurisdictions.

    For security teams, the geopolitical dimension means threat intelligence needs to include nation-state actor profiles, not just criminal groups. IBM’s X-Force Threat Intelligence and CISA’s cybersecurity advisories both provide actionable attribution and indicator data that enterprise teams can operationalize.

    11. Cloud-native security and multi-cloud complexity

    Most enterprises now run workloads across two or more cloud providers, and the security model for each differs enough to create gaps at the seams. Identity federation, network segmentation, and logging configurations that work correctly in one cloud environment do not automatically transfer to another. Attackers know this and target the integration points.

    Cloud-native security in 2026 centers on a few non-negotiable practices: cloud security posture management (CSPM) tools that continuously audit configurations against security benchmarks, workload protection platforms that extend Zero Trust principles to containers and serverless functions, and unified logging that aggregates events across providers into a single detection surface. The role of cybersecurity in business operations is increasingly inseparable from cloud architecture decisions, which means security leaders need a seat at the table when cloud strategy is set, not after the contracts are signed.

    12. IoT and OT security: the convergence problem

    Operational technology (OT) environments, including manufacturing systems, utilities, and building management infrastructure, were designed for reliability and longevity, not security. Many OT devices run firmware that cannot be patched, communicate over protocols with no authentication, and sit on networks that were never designed to be connected to the internet. The convergence of IT and OT networks, driven by efficiency and remote monitoring demands, has imported IT-style threats into environments that lack IT-style defenses.

    The 2026 priorities for IoT and OT security include network segmentation that isolates OT systems from IT and internet traffic, passive monitoring tools that detect anomalies without disrupting industrial protocols, and asset inventory programs that actually know what is on the OT network. The NERC CIP-003-11 standard for bulk electric system cyber systems is one model for how sector-specific OT security requirements are evolving, and similar frameworks are developing in water, oil and gas, and manufacturing.

    13. Where cybersecurity budgets are going in 2026

    Security budgets are growing, but the allocation is shifting. Spending on traditional perimeter security tools is flat or declining, while investment in identity and access management, AI-assisted detection, and cloud security is accelerating. MDR services are capturing budget that previously went to building internal SOC capacity, particularly in mid-market organizations where the economics of a fully staffed SOC do not work.

    Board-level attention to cyber risk has translated into more direct budget conversations. CISOs who can quantify risk in financial terms, using frameworks like FAIR (Factor Analysis of Information Risk), are getting better budget outcomes than those presenting technical metrics alone. Cyber insurance premiums continue to rise, and insurers are increasingly requiring documented security controls as a condition of coverage, which creates a secondary driver for investment in areas like MFA, endpoint detection, and incident response planning. For executives navigating these decisions, the technology leadership trends for 2026 provide useful context on how security investment fits within the broader technology strategy picture.


    Cybersecurity in 2026 rewards organizations that treat it as a business function, not a technical department. The enterprises getting ahead are the ones where security leaders have direct access to the board, where AI deployment decisions include security review from day one, and where regulatory compliance is treated as a floor rather than a ceiling.

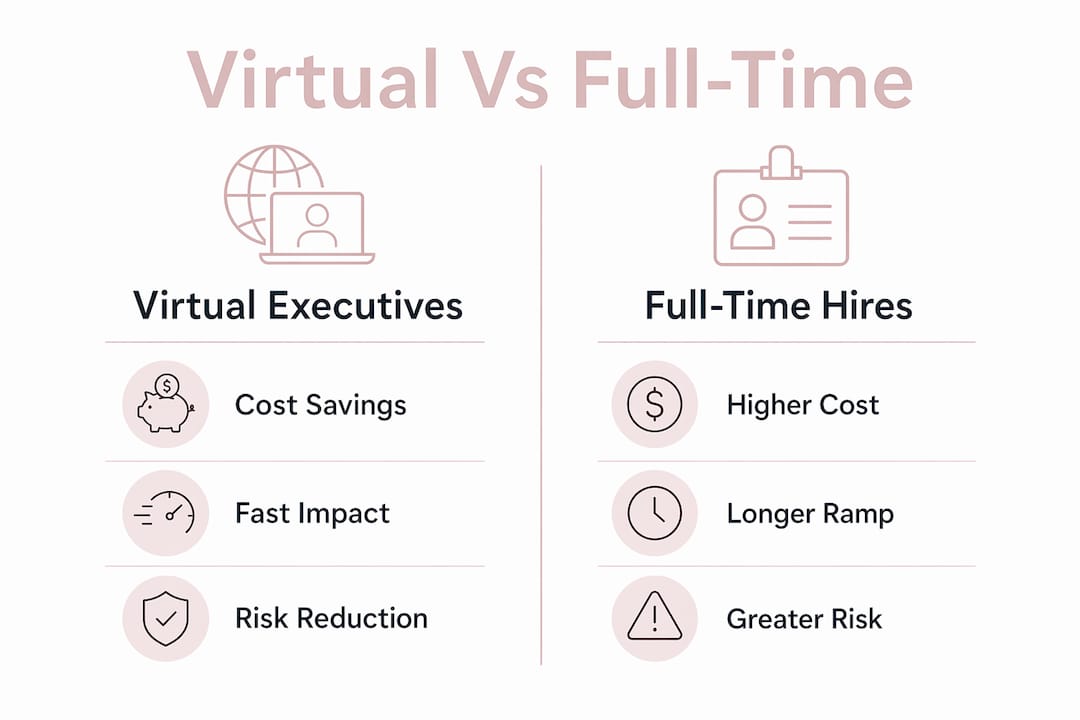
    If your organization is navigating these shifts without a dedicated technology executive, a virtual CIO with cybersecurity depth can provide the strategic oversight you need without the cost and timeline of a full-time hire. Orloffphillips works with mid-sized and large organizations to build security programs that are proportionate to the actual threat picture, not just the compliance checklist.

    https://orloffphillips.com

    Key Takeaways

    The most important security reality of 2026 is that AI agent adoption, regulatory deadlines, and quantum urgency are converging simultaneously, and organizations that address them in silos will face compounding exposure.

    PointDetails
    AI agent security gap54% of enterprises have had an AI agent incident; 69% still allow credential sharing among agents. Only 30% of enterprises isolate high-risk agents in sandboxed environments.
    CIRCIA 72-hour reportingThe CIRCIA final rule expected in September 2026 requires breach reports within 72 hours of a confirmed covered incident.
    Quantum-safe cryptographyNIST post-quantum standards are finalized; enterprises must inventory cryptographic dependencies and begin migration planning now.
    Zero Trust outcomesEnterprises that adopted Zero Trust before 2024 show substantially better breach containment compared to peers on perimeter-based models.
    Budget shiftSecurity investment is moving from perimeter tools toward identity management, AI-assisted detection, and MDR services.
  • Cybersecurity Risk Assessment Guide for IT Teams

    Cybersecurity Risk Assessment Guide for IT Teams

    A cybersecurity risk assessment is defined as a structured process for identifying, analyzing, and prioritizing threats to an organization’s information assets so that security decisions are defensible, not reactive. The industry standard term for this process is “information security risk evaluation,” formalized under NIST SP 800-30, ISO 27005, and the CIS Controls framework. Every security team conducting this work needs a clear cybersecurity risk assessment guide, because the gap between a compliance checkbox exercise and a genuinely useful assessment comes down to methodology and execution. Organizations that treat risk assessments as living processes, not one-time reports, consistently make better security investments and respond faster when threats materialize.

    What does a cybersecurity risk assessment guide actually cover?

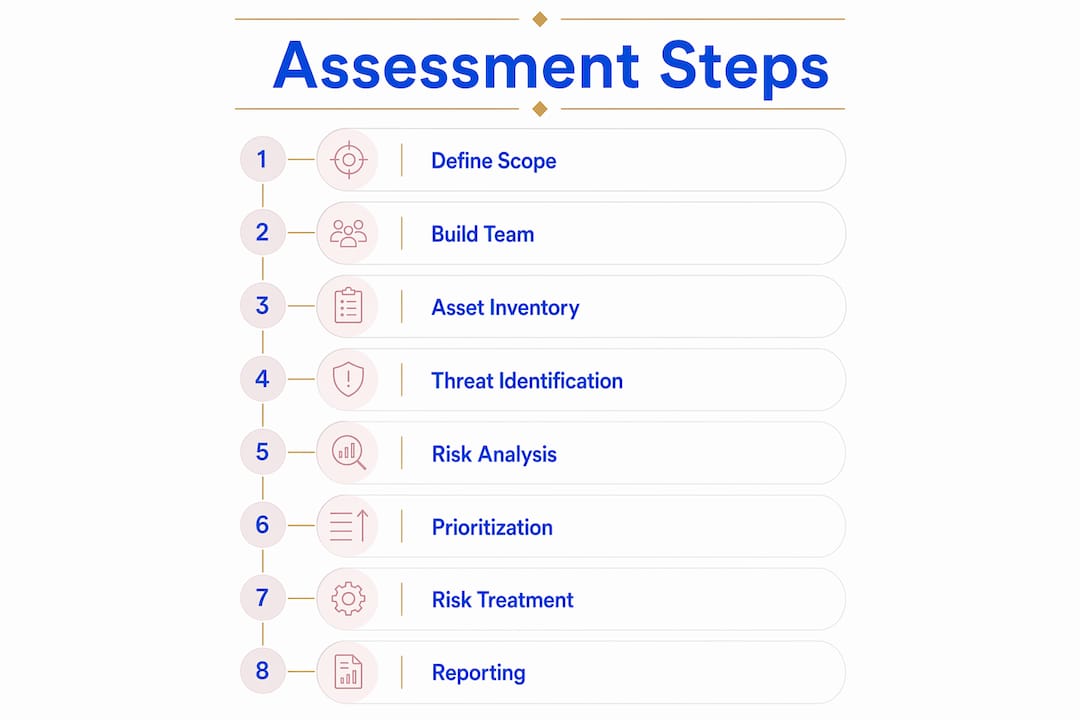
    A complete cybersecurity risk assessment follows 7–9 core steps: scope definition, asset inventory, threat identification, vulnerability identification, risk analysis, risk prioritization, treatment planning, implementation, and ongoing monitoring. Each step builds on the last. Skipping asset inventory, for example, means your threat analysis has no anchor, and your risk scores will reflect guesswork rather than reality.

    The foundational standards give you the structure. NIST SP 800-30 defines the risk assessment process at the federal level and is widely adopted across private industry. ISO 27005 provides a complementary framework for information security risk management. The CIS Controls offer a prioritized set of security actions that map directly to common risk categories. Using all three together gives your assessment both rigor and practical grounding.

    Hands holding NIST cybersecurity documents

    Risk assessments serve primarily as decision-support tools that must be evidence-driven and outcome-focused. That distinction matters. A report that lists 200 vulnerabilities without telling leadership which three to fix first has failed its purpose. The goal is not completeness for its own sake. The goal is clarity about where your organization is most exposed and what to do about it.

    Beyond compliance, a well-executed assessment gives your organization a defensible basis for security spending. Regulators, auditors, and boards all ask the same question: “How do you know your controls are appropriate?” A documented risk assessment is your answer.

    How to execute a step-by-step cybersecurity risk assessment

    Define scope and build your team

    Scope definition is the single decision that most determines assessment quality. A scope that is too narrow produces a false sense of security. A scope that is too broad produces a report no one can act on. Define scope by business function first, then map it to systems, data flows, and physical locations.

    Infographic displaying cybersecurity risk assessment steps

    Assessment depth depends heavily on resource allocation and team composition. Multi-disciplinary teams with longer timelines produce more granular and actionable insights. That is not an argument for unlimited budgets. It is an argument for being deliberate about who sits in the room.

    Your assessment team should include:

    • Security engineers who understand technical controls and vulnerability data
    • Legal counsel who can identify regulatory obligations and data classification requirements
    • Operations managers who know which systems are truly mission-critical
    • HR representatives who can address insider threat and personnel risk factors
    • Finance or risk officers who translate security findings into business impact language

    Failing to include legal, operational, and business stakeholders leads to superficial results and poor organizational buy-in. Security teams that run assessments in isolation consistently produce findings that never get funded or remediated.

    Conduct asset inventory and threat identification

    Asset inventory is not glamorous work, but it is the foundation of every credible risk analysis. Catalog hardware, software, data repositories, cloud services, third-party integrations, and physical access points. Classify each asset by sensitivity and criticality to business operations. An unclassified asset is an unmanaged risk.

    Threat identification follows asset inventory. Map known threat actors, attack vectors, and threat events to each asset category. Use sources like the MITRE ATT&CK framework, CISA advisories, and your own incident history. Pair threat identification with vulnerability scanning and manual review to surface exploitable weaknesses.

    Pro Tip: Run your asset inventory against your network diagram and your vendor contract list simultaneously. Assets that appear in only one of the three sources are your highest-risk blind spots.

    NIST CSF 2.0 combined with SP 800-30 provides a repeatable, control-based, outcome-focused framework that aligns cybersecurity outcomes with business priorities. Using this combination means your assessment produces findings that map directly to existing controls, making gap analysis faster and remediation planning more precise.

    For fintech and B2B SaaS environments, specialized risk identification methods for asset and process-based assessments add significant value, particularly where regulatory exposure is high and data flows cross multiple jurisdictions.

    How to analyze, prioritize, and treat cybersecurity risks

    Score risks using inherent and residual risk

    Every risk carries two values: inherent risk and residual risk. Inherent risk is the exposure level before any controls are applied. Residual risk is what remains after your existing controls are factored in. The gap between the two tells you whether your current controls are working or whether you are accepting more risk than you realize.

    Effective risk prioritization converts qualitative ratings into numerical scores based on business impact, allowing objective ranking within limited budget constraints. A five-point likelihood scale combined with a five-point impact scale produces a 25-point risk matrix. Risks scoring above 15 typically require immediate treatment. Risks scoring below 6 are candidates for acceptance with documentation.

    The four treatment options are:

    1. Mitigate. Implement or strengthen controls to reduce likelihood or impact.
    2. Transfer. Shift financial exposure through cyber insurance or contractual liability clauses.
    3. Avoid. Eliminate the activity or system that creates the risk.
    4. Accept. Consciously document the decision to carry the residual risk.

    Risk response options including acceptance require documented decisions and conscious management of residual risk. Acceptance without documentation is not a risk decision. It is negligence with plausible deniability.

    Align risk priorities with enterprise objectives

    NIST guidance requires mapping cyber risks to mission-essential functions within an Enterprise Risk Management framework. That means your risk register cannot live only in the security team’s spreadsheet. It must connect to the business functions that generate revenue, serve customers, or fulfill regulatory obligations.

    A formal Cybersecurity Risk Register should integrate with the enterprise risk register, mapping risks to business mission and enabling optimized capital allocation. When a CISO presents risk findings to a board, the most persuasive frame is always business impact, not technical severity.

    Pro Tip: Before presenting risk findings to leadership, translate each top-10 risk into a dollar-range business impact estimate. Boards respond to financial exposure far more reliably than to CVSS scores.

    Communicating risk priorities to leadership requires plain language, a clear ranking, and a recommended action for each top risk. A one-page risk summary with a heat map is more effective than a 40-page technical report for driving executive decisions.

    What are the most common pitfalls in cybersecurity risk assessments?

    The most damaging mistake security teams make is limiting assessments to technical elements like IP addresses and software vulnerabilities. That approach misses procedural failures, physical access risks, and personnel threats, which account for a significant share of actual security incidents.

    Other pitfalls that consistently undermine assessment value:

    • Treating the assessment as a compliance event. Compliance deadlines create artificial urgency and narrow scope. A risk assessment built around an audit calendar produces findings that satisfy auditors, not security teams.
    • Weak scope definition. Scopes that exclude cloud environments, third-party vendors, or remote work infrastructure leave the most dynamic parts of your attack surface unexamined.
    • No governance structure before you start. Risk register governance, including defining roles for risk acceptance and sign-off before assessment begins, avoids decision bottlenecks after findings are delivered. Without pre-defined ownership, findings sit in a queue while stakeholders debate accountability.
    • Ignoring the human layer. Phishing susceptibility, privileged access abuse, and contractor onboarding gaps are personnel risks that no vulnerability scanner will surface.

    Continuous monitoring and periodic reassessment are critical to maintaining an accurate risk profile and adapting to system or threat changes. A risk assessment completed in january is materially outdated by july if your environment has changed, new threat intelligence has emerged, or a major vendor has been breached.

    “A cybersecurity risk assessment that sits on a shelf is not a security asset. It is a liability. The moment it stops reflecting your current environment, it gives leadership false confidence and security teams a false mandate.”

    Alignment between cybersecurity risk registers and enterprise risk management frameworks ensures that cyber risks receive appropriate executive attention and funding. Without that alignment, security teams fight for budget against business units that speak the language of financial risk natively. For a broader view of how cybersecurity fits business strategy, integrating risk management into resilience planning is the logical next step.

    Key Takeaways

    A cybersecurity risk assessment produces defensible security decisions only when it integrates structured methodology, cross-functional governance, and continuous reassessment into a single repeatable process.

    PointDetails
    Define scope by business functionScope to business operations first, then map to systems and data flows to avoid blind spots.
    Build cross-functional teamsInclude legal, operations, HR, and finance alongside security engineers for complete risk coverage.
    Score inherent and residual riskCalculate both values to reveal whether existing controls are actually reducing exposure.
    Integrate with enterprise risk managementMap cyber risks to mission-critical functions so findings compete for budget on business terms.
    Reassess continuouslyTreat the risk assessment as a living process, not a static report, to maintain an accurate risk profile.

    Why most risk assessments fail before they start

    The hardest lesson I have learned working with mid-sized and large organizations on cybersecurity strategy is that most assessments fail in the planning phase, not the execution phase. Teams spend weeks on threat modeling and vulnerability scanning, then deliver findings to a leadership team that was never involved in defining what “acceptable risk” means for the organization. The result is a technically sound document that produces no decisions and no funding.

    The fix is not a better methodology. The fix is governance. Establishing governance early in the assessment lifecycle clarifies risk ownership and accelerates remediation. That means getting executives to agree on risk appetite, risk tolerance, and decision authority before the first asset is inventoried. Without those agreements, every finding becomes a negotiation.

    My second observation is that organizations consistently underestimate the value of mapping risks to mission-critical functions rather than to systems. A vulnerability in a payroll system is not just a technical finding. It is a business continuity risk, a regulatory exposure, and a reputational liability. When security teams frame findings in those terms, remediation timelines shrink dramatically.

    The organizations that get the most value from risk assessments treat them as a continuous improvement program. They schedule quarterly reviews, assign risk owners who report to the C-suite, and update their risk registers whenever a significant system change or threat event occurs. That cadence is not a burden. It is what separates organizations that manage risk from organizations that react to incidents.

    — Orloff

    Orloffphillips technology leadership for cybersecurity risk programs

    Cybersecurity risk management requires both technical depth and executive alignment. Orloffphillips works with mid-sized and large organizations across the United States to build risk assessment programs that connect security findings to business outcomes.

    https://orloffphillips.com

    Whether your organization needs a fractional CISO to lead your first formal assessment or an experienced technology strategist to align your risk register with enterprise priorities, Orloffphillips provides the leadership capacity to move from findings to decisions. Explore the technology strategy guide to see how risk management integrates with broader technology leadership. For organizations building or maturing their cybersecurity strategy, Orloffphillips offers tailored advisory that fits your organization’s scale and risk appetite.

    FAQ

    What is a cybersecurity risk assessment?

    A cybersecurity risk assessment is a structured process for identifying threats, vulnerabilities, and impacts to an organization’s information assets, following frameworks like NIST SP 800-30 and ISO 27005. The output is a prioritized risk register that guides security investment decisions.

    How often should organizations conduct a risk assessment?

    Organizations should conduct a formal risk assessment at least annually, with continuous monitoring and triggered reassessments whenever significant system changes, new threat intelligence, or major incidents occur.

    What is the difference between inherent risk and residual risk?

    Inherent risk is the exposure level before any controls are applied. Residual risk is what remains after existing controls are factored in. The gap between the two reveals whether current controls are effective.

    Which framework is best for a cybersecurity risk assessment?

    NIST CSF 2.0 combined with SP 800-30 provides a repeatable, control-based framework that aligns cybersecurity outcomes with business priorities and is widely recognized across both public and private sectors.

    Who should be involved in a cybersecurity risk assessment?

    Effective assessments require cross-functional teams that include security engineers, legal counsel, operations managers, HR representatives, and finance or risk officers. Excluding business stakeholders consistently produces findings that fail to gain organizational support or funding.

  • Why Choose Virtual Executives: The 2026 Leader’s Guide

    Why Choose Virtual Executives: The 2026 Leader’s Guide

    Virtual executives are senior leaders who deliver part-time, high-impact expertise remotely, giving businesses C-suite capability without the cost or commitment of a full-time hire. The industry term for this model is “fractional executive,” and understanding why choose virtual executives starts with one fact: fractional retainers range $3,000–$20,000 per month versus $200,000–$400,000 for a fully loaded full-time executive. That gap changes the math for every mid-sized company navigating growth, digital transformation, or a leadership gap. This guide covers the benefits of virtual executives, the scenarios where they excel, the role AI now plays, and a practical framework to decide if this model fits your organization.

    Why choose virtual executives over full-time hires?

    The financial case is the starting point, but it is not the whole story. Hiring fractional executives saves 40–70% compared to fully loaded full-time hires when you account for salary, benefits, equity dilution, and recruiting fees. That saving frees capital for product development, sales, or technology infrastructure where it creates direct value.

    Speed is the second major advantage. Fractional executives deliver impact in 30–45 days compared to 3–6 months for a traditional full-time hire. A company facing a technology audit or a fundraising round cannot wait six months for a CTO to reach full productivity.

    Virtual executives collaborating in video meeting

    Risk reduction is the third pillar. Executive hiring failure rates run 40–50% within 18 months, making full-time C-suite hiring one of the highest-risk decisions a company makes. Fractional engagements remove that exposure. You can pause, end, or convert the role to full-time with short notice, which is particularly valuable during fundraising cycles, pivots, or market uncertainty.

    The advantages of remote executives also include network access. Virtual executives bring extensive professional networks that accelerate investor introductions, legal counsel, and partner relationships beyond what most in-house teams can build. That network effect often delivers more value than the role itself.

    Pro Tip: Before engaging a fractional executive, ask for three specific examples of measurable outcomes they delivered within the first 60 days at a previous client. Speed to impact is their core value proposition, and they should be able to prove it.

    • Cost savings: 40–70% reduction versus full-time, covering salary, benefits, equity, and recruiting.
    • Speed: Impact in 30–45 days versus 3–6 months for a traditional hire.
    • Risk reduction: Engagements can be paused or ended without the legal and financial weight of terminating a full-time executive.
    • Expertise on demand: Access to senior leaders with multi-stage company experience who would be unaffordable full-time.
    • Network leverage: Relationships with investors, attorneys, and partners that compress go-to-market timelines.

    How do virtual executives adapt to specific business needs?

    The fractional model fits well-defined situations. Startups that need a CFO for a Series A process, scaling companies that need a COO to build operational systems, and organizations in leadership transition all benefit from fractional C-suite leadership without committing to a permanent hire. The model works because the scope is clear and the timeline is finite.

    Infographic comparing virtual and full-time executives

    Fractional executives excel at 10–25 hours per week when the role addresses a specific functional gap or project. A fractional CHRO building a compensation framework, a fractional CTO leading a platform migration, or a virtual COO designing scalable processes are all well-matched use cases. The role scope matches the fractional involvement.

    Common scenarios where virtual executive services deliver the most value:

    • Startups (Series A–C): Need CFO or CTO expertise for fundraising, compliance, or technology architecture but cannot justify a full-time salary.
    • Volatile or transitional markets: Companies facing rapid change need flexible leadership that can be scaled up or down without restructuring.
    • Leadership gaps: An unexpected departure creates an immediate need for experienced interim leadership while a permanent search runs.
    • Specific projects: A cybersecurity overhaul, ERP implementation, or digital transformation initiative requires focused expertise for 6–12 months.

    The model does have limits. Founders often delay hiring executive support due to cost perceptions, but the bigger mistake is using a fractional model for roles that genuinely require full-time daily presence. A Chief People Officer building culture in a 500-person company through a merger needs to be in the room every day. A fractional arrangement in that context creates gaps that hurt the business.

    What role does AI play in virtual executive services?

    AI is changing what a virtual executive can deliver. The shift is not about automating reports. 55% of CFOs expect AI to take over more strategic work than routine tasks, which means the virtual CFO of 2026 is not just reviewing numbers. They are using AI to run scenario models, stress-test assumptions, and surface risks that a human analyst would miss in a standard review cycle.

    The next wave beyond automation is virtual executives acting as strategic thought partners who challenge assumptions and provide multi-angle analysis. An AI-augmented virtual CTO can monitor your entire technology stack, flag vendor contract anomalies, and prepare a board-ready risk briefing in hours rather than weeks. That is a qualitative leap in what part-time executive involvement can accomplish.

    “The virtual deputy CFO model represents a shift from task automation to strategic agency. The executive is no longer just reviewing outputs. They are using AI to continuously challenge the business’s financial assumptions and provide insight that a full-time hire without those tools simply cannot match.”

    Governance is the non-negotiable counterpart to AI augmentation. Governance frameworks are required for AI-driven virtual executive teams to manage delegation, error detection, and human oversight. Without a clear authority matrix, an AI-augmented executive role can produce confident but incorrect outputs with no one accountable for catching the error. Business leaders considering AI-augmented virtual executive services should review AI governance credentials to understand what oversight structures are now considered standard practice.

    Pro Tip: When evaluating an AI-augmented virtual executive, ask specifically how errors in AI-generated analysis are detected and escalated. The answer reveals whether the governance architecture is real or theoretical.

    How do you decide if a virtual executive is right for your company?

    The decision starts with mandate clarity. A clear scope with measurable 90-day success criteria is the single biggest predictor of a successful fractional engagement. Without it, the executive spends the first month diagnosing what the problem actually is, and you pay for that discovery time.

    Use this four-step framework before you engage:

    1. Define the problem. Write one sentence describing the specific gap: “We need a CTO to lead our cloud migration from on-premise infrastructure to AWS by Q3.” Vague mandates produce vague results.
    2. Set 90-day metrics. Identify three measurable outcomes the executive must deliver in the first 90 days. These become the engagement brief and the performance baseline.
    3. Assess presence requirements. If the role requires daily physical presence, team culture immersion, or real-time crisis response, a fractional model will underperform. Be honest about this before signing.
    4. Run the cost-benefit comparison. Compare the fractional retainer against the fully loaded cost of a full-time hire, including recruiting fees, benefits, and the 3–6 month ramp time where you are paying full salary for partial output.
    Decision factorFractional modelFull-time hire
    Time to impact30–45 days3–6 months
    Monthly cost$3,000–$20,000$17,000–$33,000+
    Engagement flexibilityPause or end with short noticeTermination costs and legal risk
    Best fitDefined scope, project-based, or transitionalOngoing daily presence, culture-critical roles

    Fractional executives demand rapid diagnosis, ruthless prioritization, and self-driven accountability to succeed. That profile is different from a full-time executive who builds into a role over a year. When you write your engagement brief, test candidates on exactly those qualities. Ask how they would prioritize in week one and what they would need from your team to move fast.

    Key Takeaways

    Virtual executives deliver the fastest, most cost-effective path to senior expertise when the engagement scope is clear, the 90-day metrics are defined, and the role does not require full-time daily presence.

    PointDetails
    Cost savings are significantFractional retainers save 40–70% versus fully loaded full-time executive costs.
    Speed to impact is a core advantageFractional executives deliver measurable results in 30–45 days versus 3–6 months for traditional hires.
    Mandate clarity drives successDefine scope and 90-day metrics before hiring to avoid costly discovery periods.
    AI augmentation raises the ceilingAI-augmented virtual executives provide strategic analysis that exceeds what a traditional part-time role could deliver.
    Governance is non-negotiableAny AI-augmented virtual executive engagement requires a clear authority matrix and human oversight structure.

    What I’ve learned from placing fractional executives in complex organizations

    The most common mistake I see is leaders treating a fractional engagement like a part-time employee. It is not. A fractional executive operates more like a specialist surgeon: they come in with a specific diagnosis, execute with precision, and leave the organization better than they found it. The engagement works when the leader on your side is equally prepared.

    The second lesson is about timing. Most founders wait too long to bring in senior help because they equate leadership with full-time cost. By the time they engage a fractional CFO or CTO, they have already made three decisions that the executive now has to undo. The preventive value of experienced fractional leadership is real, and it is consistently underpriced by the market.

    On AI augmentation: I am genuinely excited about what AI-augmented virtual executives can do, but I am cautious about the governance gap. Most organizations do not yet have the authority matrices and error-detection protocols that structured human oversight requires. The technology is ahead of the governance, and that is a risk leaders need to price in before they deploy it.

    My practical advice: start with a fractional executive in one function where the scope is clear and the metrics are measurable. Use that engagement to learn how your organization absorbs external executive leadership. Then expand. The companies that get the most from this model treat the first engagement as a capability-building exercise, not just a problem-solving exercise.

    — Orloff

    How Orloffphillips supports your virtual executive strategy

    Orloffphillips works with mid-sized and large organizations across the United States to identify, structure, and integrate virtual executive roles that deliver measurable results. The firm specializes in fractional CIO, CTO, and COO engagements, with deep expertise in digital transformation, cybersecurity, and IT roadmapping.

    https://orloffphillips.com

    Every engagement starts with a mandate-clarity session that produces a defined scope, 90-day success metrics, and a governance framework before the executive starts. If you are evaluating technology leadership specifically, the virtual CIO selection guide walks through the exact criteria, cost benchmarks, and interview questions you need to make a confident decision. For a broader view of how fractional executive models drive agility and results, Orloffphillips has the resources and the track record to guide your next step.

    FAQ

    What is a virtual executive?

    A virtual executive, also called a fractional executive, is a senior leader who works part-time and remotely for a company, providing C-suite expertise without a full-time employment commitment.

    How much does a virtual executive cost?

    Fractional executive retainers typically range from $3,000 to $20,000 per month, compared to $200,000–$400,000 annually for a fully loaded full-time hire.

    How fast can a virtual executive make an impact?

    Fractional executives typically deliver measurable impact within 30–45 days, significantly faster than the 3–6 month ramp time for a full-time hire.

    When is a virtual executive not the right choice?

    A virtual executive is not the right fit when the role requires full-time daily physical presence, deep cultural immersion, or real-time crisis response that a part-time arrangement cannot support.

    What roles work best as virtual executive positions?

    Fractional CFO, CTO, COO, and CHRO roles are the most common and effective, particularly for startups, companies in transition, or organizations running defined technology or operational projects.

  • What Is an IT Roadmap? A Guide for Business Leaders

    What Is an IT Roadmap? A Guide for Business Leaders

    An IT roadmap is defined as a sequenced, high-level strategic plan that aligns technology investments with business outcomes over a 12 to 36 month horizon. The formal industry term is “IT strategy roadmap,” and understanding the distinction matters. Most organizations confuse it with a project plan or a vendor release schedule. Neither is correct. A technology roadmap answers one question: “What technology decisions, in what order, will move this organization from where it is today to where it needs to be?” Orloffphillips works with executive teams across the United States to build exactly this kind of decision instrument, not documentation for its own sake.

    What is an IT roadmap, and how does it differ from strategy and project plans?

    An IT roadmap is not the same as an IT strategy, and treating them as interchangeable is one of the most common mistakes business professionals make. Strategy is the destination. The roadmap is the sequenced route, with timing, priorities, and ownership assigned to each leg of the journey. Project plans sit below both, detailing the tactical execution of individual initiatives.

    Think of it this way. Your IT strategy says, “We will become a cloud-first organization to support 40% headcount growth over three years.” Your IT roadmap says, “We will migrate core infrastructure in Q1, consolidate vendor contracts in Q2, and deploy the new collaboration platform in Q3.” Your project plans say, “The infrastructure migration will require these 14 tasks, these three team members, and this budget.”

    Professional interacting with IT roadmap tablet

    The three layers serve different audiences. The IT strategy speaks to the board and CEO. The roadmap speaks to the executive team and department heads. Project plans speak to the teams doing the work.

    Key distinctions that business professionals must keep clear:

    • IT strategy defines the business and technology destination, typically tied to a three to five year vision.
    • IT roadmap sequences the path with timing, priorities, and named owners across a 12 to 36 month window.
    • Project plans break initiatives into tasks, timelines, and resource assignments at the execution level.
    • Themes vs. tasks: A roadmap focuses on strategic themes and sequencing rather than listing every tactical task. Leadership needs direction, not a task list.

    The roadmap’s power comes from what it forces you to decide. When you sequence initiatives, you expose dependencies, resource conflicts, and trade-offs that a strategy document never surfaces.

    How is an effective IT roadmap structured and maintained?

    An effective IT roadmap follows a defined lifecycle, not a one-time planning event. The lifecycle includes defining business outcomes, assessing the current technology state, identifying risks, prioritizing by business impact, sequencing work, assigning owners and budgets, and reviewing quarterly. Each stage builds on the previous one, and skipping any step produces a plan that cannot be executed.

    The three time horizons

    Time horizons differentiate commitment levels across the roadmap. Near-term initiatives (0–6 months) are binding decisions with assigned budgets and owners. Mid-term initiatives (6–18 months) represent directional intent, subject to refinement as conditions change. Long-term initiatives (18–36 months) capture ambitions that inform current decisions without locking resources prematurely. This structure lets leaders apply appropriate governance at each horizon without over-engineering plans that are still evolving.

    Infographic showing IT roadmap time horizons

    Sequencing versus prioritization

    Most teams prioritize. Fewer teams sequence properly. Sequencing defines order and pacing based on dependencies and capacity, while prioritization simply ranks importance. A cybersecurity upgrade may rank lower in priority than a new CRM platform, but if the cybersecurity work is a prerequisite for the CRM integration, sequencing puts it first. Ignoring this distinction breaks roadmap schedules in practice.

    The review cadence

    1. Define outcomes first. Start with the business goals the roadmap must support, not the technology you want to buy.
    2. Assess the current state honestly. Inventory endpoints, licenses, contracts, and controls before sequencing anything.
    3. Identify risks and dependencies. Map what blocks what before assigning timelines.
    4. Prioritize by business impact. Use a scoring model to reduce bias and make trade-offs visible.
    5. Sequence with dependencies in mind. Order work by what must come first, not just what leadership prefers.
    6. Assign owners and budgets. Every initiative needs a named accountable person and a funding commitment.
    7. Review quarterly with live data. Successful roadmaps are updated quarterly with operational data, not revised once a year during budget season.

    Pro Tip: Set a fixed quarterly review date on the executive calendar before you publish the roadmap. A roadmap that has no scheduled review date becomes a static document within 90 days.

    What are the key benefits of an IT roadmap for business professionals?

    An IT roadmap secures executive buy-in by reframing technology investments as business enablers rather than cost centers. Connecting IT initiatives to specific business metrics like reducing system downtime or supporting headcount growth increases executive engagement and funding support. This shift from technical justification to business justification changes how the C-suite responds to IT requests.

    The governance benefit is equally significant. A roadmap makes trade-offs visible. When a new initiative appears mid-year, the roadmap shows exactly what gets displaced or delayed. That transparency prevents the common pattern where IT teams absorb new requests without adjusting scope, leading to overloaded teams and missed commitments.

    Key benefits business professionals gain from a well-maintained IT roadmap:

    • Executive alignment: Technology investments are framed in business language, making approval conversations faster and more productive.
    • Resource clarity: Sequencing exposes capacity conflicts before they become crises, not after.
    • Decision support: Roadmaps support consistent governance decisions by clarifying strategic intent, sequencing, trade-offs, and accountability in one view.
    • Adaptability: Quarterly updates let the organization respond to market shifts without abandoning the overall direction.
    • Stakeholder communication: A roadmap gives department heads a clear view of what technology changes are coming and when, reducing surprise and resistance.

    The IT planning roadmap also supports budget cycles. When technology initiatives are sequenced and tied to business outcomes, finance teams can plan capital and operating expenditures with greater confidence. That connection between IT and financial planning is where many organizations find the most immediate value.

    For organizations integrating new technologies into their business strategy, the roadmap provides the structure that prevents technology adoption from outpacing organizational readiness.

    How do you create and implement an IT roadmap effectively?

    Building a technology roadmap starts with an honest assessment of the current environment. Skipping the current-state assessment is the leading cause of IT roadmap failure, because without it, sequencing is guesswork. Inventory every significant system, contract, license, and control before writing a single initiative.

    Once the current state is documented, translate the business strategy into technology outcomes. Do not start with technology and work backward. Start with questions like: “What does the business need to achieve in the next 18 months?” and “What technology gaps prevent that?” The answers define the roadmap’s scope.

    The table below shows how to evaluate initiatives before sequencing them:

    Evaluation CriteriaWhat to assess
    Business impactDoes this initiative directly support a named business goal?
    DependenciesWhat must be completed before this initiative can start?
    Effort and costWhat resources, budget, and time does this require?
    RiskWhat happens if this is delayed or skipped?
    OwnershipWho is accountable for delivery and outcomes?

    Use a scoring model to rank initiatives against these criteria. Scoring reduces the influence of internal politics and makes the prioritization logic defensible to the executive team.

    After prioritization, sequence based on dependencies and pacing, not just scores. An initiative ranked second may need to start first because a higher-ranked initiative depends on its output. This is the step most IT planning roadmap processes skip, and it is the step most responsible for schedule failures.

    Assign a named owner and a confirmed budget to every initiative before publishing the roadmap. Initiatives without owners are wishes, not plans. Initiatives without budgets are aspirations, not commitments.

    Pro Tip: Build your roadmap in a format that can be updated without rebuilding from scratch. A live document reviewed quarterly with operational data outperforms a polished annual presentation every time. The IT risk management checklist from Orloffphillips provides a practical framework for identifying risks during the current-state assessment phase.

    Key Takeaways

    An IT roadmap is only as valuable as the governance discipline behind it. Organizations that treat it as a living decision tool consistently outperform those that treat it as annual documentation.

    PointDetails
    Definition and scopeAn IT roadmap sequences technology initiatives across a 12–36 month horizon tied to business outcomes.
    Strategy vs. roadmapStrategy sets the destination; the roadmap defines the sequenced route with timing and ownership.
    Sequencing over prioritizationDependencies and pacing determine order. Ranking alone produces broken schedules.
    Quarterly review disciplineUpdate the roadmap with live operational data every quarter to prevent it from becoming stale.
    Executive alignmentFraming IT investments in business outcome language secures funding and reduces approval friction.

    The roadmap mistake I see most often

    Every organization I have worked with has produced an IT roadmap at some point. Far fewer have produced one that actually guided decisions six months after it was published.

    The most common failure is not poor planning. It is building the roadmap before the IT strategy is clearly articulated. Without a clear strategic intent, the roadmap becomes a list of projects someone wanted to do anyway. It has no governance value because there is no agreed destination to sequence toward.

    The second failure is treating the roadmap as a deliverable rather than a decision instrument. Teams spend weeks producing a polished presentation, publish it, and then never open it again until the next annual planning cycle. By then, three major business conditions have changed and the roadmap is fiction.

    What actually works is treating the roadmap as a live readout. It sits in a shared space. It gets reviewed in every executive meeting where a technology decision is on the table. When a new initiative appears, the first question is: “Where does this fit in the sequence, and what does it displace?” That discipline is what separates organizations that execute well from those that are always surprised by IT costs and delays.

    The technology roadmapping guide Orloffphillips publishes for IT leaders covers the quarterly review process in detail. The process is not complicated. The discipline to follow it consistently is where most organizations need support.

    — Orloff

    How Orloffphillips supports IT roadmap execution

    Building a technology roadmap is straightforward in theory. Executing one that holds up through budget cycles, leadership changes, and shifting business priorities requires experienced guidance.

    https://orloffphillips.com

    Orloffphillips works with executive teams at mid-sized and large organizations across the United States to build IT roadmaps that function as real governance tools. The approach connects technology initiatives directly to business outcomes, sequences work based on dependencies and capacity, and establishes the review cadence that keeps the roadmap current. For organizations that need experienced strategic IT leadership without a full-time executive commitment, Orloffphillips offers fractional CIO and CTO engagements designed to deliver exactly that.

    FAQ

    What is an IT roadmap in simple terms?

    An IT roadmap is a sequenced plan that shows which technology initiatives an organization will pursue, in what order, and over what timeframe to achieve specific business goals. It typically covers a 12 to 36 month horizon.

    How is an IT roadmap different from an IT strategy?

    The IT strategy defines where the organization wants to go with technology. The IT roadmap defines the sequenced steps, timing, and ownership required to get there.

    How often should an IT roadmap be updated?

    An IT roadmap should be reviewed and updated quarterly using live operational data. Annual updates allow the roadmap to drift out of alignment with current business conditions.

    What is the most common reason IT roadmaps fail?

    The two leading causes are skipping the current-state assessment and building the roadmap before the IT strategy is clearly defined. Both produce a plan that cannot be executed accurately.

    Who owns the IT roadmap in an organization?

    The IT roadmap is owned by the senior technology leader, typically the CIO or CTO, but it requires active input and approval from the executive team to function as a governance tool.

Orloff
Orloff AI AI
Online — Direct answers, no fluff
Powered by Orloff Phillips